Tailwinds often make jet planes fly faster than they would regularly fly. In this post, I talk about economic tailwinds that help the economy grow more quickly.
Strangely enough, the economy seems to move from tailwind to tailwind, as new resources are discovered, as population expands, and as central banks figure out new ways to fix the economy. In this post, I will describe some tailwinds affecting the economy. Many of these have recently lost their value or are likely to lose their value in the future. The long-term trend seems to be toward tailwinds becoming available to some parts of the world economy, but there may be major dips and shifts with respect to which segments of the world economy are favored.
[1] The tailwind of very low oil prices
Before 1972, the US economy had the tailwind of a good supply of oil available at very low prices. Goods could be made cheaply with oil products, and new devices, such as automobiles, could be operated very inexpensively. New technology could take hold quickly because resources, including energy resources, were easily available. For these reasons, the economy could grow very quickly, with little use of debt.
Figure 1. Average annual inflation-adjusted oil prices, based upon data of the 2023 Statistical Review of World Energy, published by the Energy Institute.
Data from the US Bureau of Economics shows that the US economy experienced an average annual growth rate of 4.8% between 1932 and 1972, which is very high by today’s standards. The same data shows that the US economy’s average annual growth rate was 2.7% for the period 1972 to 2022.
[2] The tailwind of falling interest rates and near zero interest rates
From 1981 to 2020, the world economy had a tailwind of generally falling interest rates.
Figure 2. Chart by the Federal Reserve of St. Louis, showing interest rates related to 3-month and 10-year US Treasuries, with US recessions noted in gray. Chart has been annotated by Gail Tverberg to point out time of generally falling long-term interest rates.
On Figure 2, the top line (in red) shows 10-year interest rates. The lower line (in blue) represents interest rates of 3-month Treasuries.
In the US, many mortgage rates have tended to follow 10-year interest rates. We all know that as mortgage rates fall, homes become more affordable to buyers. As more homes become affordable to buyers, the “demand” for homes goes up. More homes are built, stimulating the economy. Similarly, buying farmland becomes more affordable. Factories become more affordable. There are more people bidding for these goods, so the selling prices tend to rise.
Figure 2 shows that short term rates have also been falling, but in a more irregular way. The fact that these rates have generally been falling has also greatly aided economic growth, since many industrial and financial loans are very short term.
It appears to me that the temporary rise in short-term interest rates between 2004 and 2006 ultimately caused the Great Recession of 2007-2009. See my academic paper, Oil Supply Limits and the Continuing Financial Crisis. Note the delayed impact of the rate rise. It is far too early to assume that the recent rise in interest rates will have no serious detrimental effects on the economy.
To try to keep the economy operating after the Great Recession, short term interest rates were brought down to close to zero for most of the time between 2008 and early 2022. These low interest rates encouraged investors to pursue new ventures that were very “iffy”– they might produce a positive return, or they might lose money. In fact, government subsidies were added, inviting investors to pursue “opportunities” that were likely to be money losers.
With this long-term tailwind of falling interest rates, capital gains were very easy to obtain. Homes became worth increased amounts, as did farms, seemingly by magic. Shares of stock tended to rise. People began to believe that there was little risk in borrowing money for questionable ventures. New high technology businesses in Silicon Valley blossomed.
In some sense, interest rates that rose in the 1960 to 1981 period (to keep the economy from racing ahead too fast) had stored up momentum that could be used in the 1981 to 2020 period.
We are now past that period of falling interest rates. In fact, we are in a new period of rising interest rates because of depleting resources, and the upward pressure these depleting resources place on inflation rates. Furthermore, a 200-year history of US interest rates shows that the recent near-zero interest rates have been an anomaly. We cannot expect interest rates to go back to the recent low level for any extended period. An interest rate of 5% or more is normal. The economy has benefitted from the temporary gift of falling interest rates, and of near zero rates, but this period is likely past.
[3] The tailwind of rising debt, relative to GDP
The fact that debt is rising, relative to GDP, is closely related to Tailwind [1] and Tailwind [2].
Figure 3. Ratio of the increase in US debt to the increase in US GDP for 5-year periods, based on data of the US Bureau of Economic Analysis.
How much debt does it take to create one dollar of GDP? In theory, both the buyer of a product (such as a vehicle), and the various organizations involved with creating the product and shipping it to the end user, will need debt to move the process along. If the government is adding a subsidy to move the process along, this will add another layer of debt.
Figure 3 shows that prior to 1981, when oil prices were low (Figure 1), it took less than one dollar of debt to facilitate the process of creating one dollar of GDP. Oil companies were sufficiently profitable that they could use their profits to reinvest in new wells as old ones depleted. They did not need to add debt to make the process work. While products such as homes might need debt for the buyers to afford them, many other products did not. In this early period, government subsidies were much more limited than today.
After 1981, the ratio of debt to GDP steadily rose. The rise was particularly steep after 2001, when China was added to the World Trade Organization (Figure 1). As China ramped up its manufacturing, the price of oil tended to rise because more oil was needed for manufacturing and shipping the goods China made. More debt was required to import this higher-priced oil, causing at least part of the increase in the debt to GDP ratio. The dip in the debt to GDP ratio in the 2014-2019 period seems to correspond to the period of lower oil prices shown in Figure 1.
In some sense, it is strange that GDP does not consider the added debt that an economy requires in order to create the goods and services that it produces. Logically, it might make sense for GDP to measure the value of goods and services added, net of the additional debt required to make these goods and services. We can see from Figure 3 that this net approach would only work up until 1981. Since 1981, it has become necessary to add more debt than the amount of additional goods and services produced. If the interest rate is 0%, perhaps this is not a major issue, but if the interest rate rises to 5% or more, a huge amount of interest to be paid. Repaying debt with interest becomes a serious problem unless the borrower is able to find a truly profitable use for the funds.
[4] The tailwind of higher population
If population is growing, there is a need for many new things, including new schools, roads, stores, and homes. This puts pressure on GDP to grow. Figure 4 shows population growth, excluding the impact of migration.
Figure 4. Natural population increase (based on births minus deaths) as a percentage of population based on data from World Population Prospects 2022 published by the United Nations.
In the 1950s and 1960, part of the reason that GDP in the More Developed parts of the world was growing rapidly was because population was growing quickly (Figure 4). This tailwind had mostly disappeared by the mid-1990s. Now, if one of the More Developed parts of the world shows population growth, it tends to be the result of increasing immigrant population.
Figure 5. World population estimates as used in the 2023 Statistical Review of World Energy by the Energy Institute. OECD is a slightly different grouping of highly developed countries than UN’s grouping. Thus, non-OECD corresponds to the population of less developed countries.
Total world population (Figure 5) keeps rising, even though birth rates have been falling because people in less developed parts of the world have been living longer. This adds to migration pressure because there are not enough goods and services available for the increased population.
[5] The US tailwind from playing “King of the Mountain”
In March 2022, the US Federal Reserve started raising interest rates. These higher interest rates can be seen as a way to push the US$ higher relative to other currencies, especially relative to currencies of poorer countries, such as Argentina and Turkey. By pushing the dollar higher, oil and other commodities become relatively cheaper to the US, and relatively more expensive to those countries with currencies whose value is low relative to the US$. Also, the higher interest rates make the US a more attractive country for other countries to invest in.
The US move to raise interest rates higher can be viewed as a “King of the Mountain” move. High interest rates can perhaps be withstood by strong economies, but they cannot be withstood by weak economies. For example, many of the poorer countries of the world have loans from the International Monetary Fund. As the US dollar strengthens relative to local currencies, these loans become more difficult to be paid back. The fact that recent interest rates are higher also makes it harder for borrowers to repay debt with interest. Weak businesses and perhaps weak governments around the world will tend to be squeezed out.
One thing that may help the US in trying such a move is that fact that US debt has a kind of moneyness quality that the debt of other countries does not have. This occurs because the US$ is the reserve currency, which in turn is related to the US being the world’s hegemon. The question becomes: How long can the US maintain this lofty position? Other countries are likely to push back and find ways to work around the use of the US$, if it is to their disadvantage.
[6] The tailwind from the “Green Energy Will Save Us” narrative
Figure 6. Figure by Gail Tverberg illustrating an economy that is trying to turn to a different direction, while the standard narrative is that business as usual can continue forever, thanks to the miracles of Green Energy.
The standard narrative about green energy saving the world from its climate change gives great opportunities for governments to subsidize wind turbines and solar panels, battery manufacturing plants, and the building of electric vehicles. These subsidies create more debt, which helps push the economy along.
The educational system is also stimulated by the “Green Energy Will Save Us” story. Educators have new courses to teach and new subjects to write academic papers about. If students are interested in studying these subjects, the US government is willing to provide debt-based funding to the prospective students. This adds another source of debt to stimulate the economy.
Of course, there is the hurdle of paying this debt back, especially if interest rates are at a new higher level. This game would not seem to be able to go on very long unless some green approach actually works. Such an approach needs to work in current devices, be low-cost to manufacture, and be affordable to customers at a price that generates taxable revenue.
[7] Over the very long run, tailwinds do seem to help the Universe grow and become more complex and more energy intense.
Eric Chaisson, in the book Cosmic Evolution: The Rise of Complexity in Nature, writes about the Universe gradually becoming more complex and having greater energy intensity. He shows images such as this one.
Figure 7. Image similar to ones shown in Eric Chaisson’s 2001 book, Cosmic Evolution: The Rise of Complexity in Nature.
We don’t understand why this happens. Evolution seems to happen in every part of the Universe. Many parts of the Universe are short-lived. Each new part of the Universe varies in random ways from its predecessors. Evolution happens through the survival those that are the best adapted to their surroundings. This happens at least partly through the laws of physics. There may be some other force involved as well. Economists talk about the Invisible Hand being helpful. Those who are religious may think of the Hand of God being involved.
We know that the Earth has survived for a very long time, despite being hit by large meteors and despite major changes in climate. In fact, early humans lived through glacial periods. There are times when economies and populations fall back considerably, but somehow the world ecosystem recovers. It may even adapt in a way that allows more opportunity for growth.
Thus, even as the economy seems to be running out of today’s tailwinds, somehow there may be future tailwinds that will push the at least segments of the world economy along in a somewhat different direction. We simply don’t know for certain how things will turn out.
Recently, I explained the key role played by diesel and jet fuel. In this post, I try to explain the energy bottleneck the world is facing because of an inadequate supply of these types of fuels, and the effects such a bottleneck may have. The world’s self-organizing economy tends to squeeze out what may be considered non-essential parts when bottlenecks are hit. Strangely, it appears to me that some central governments may be squeezed out. Countries that are rich enough to have big pension programs for their citizens seem to be especially vulnerable to having their governments collapse.
Figure 1. World supply of diesel and jet fuel per person, based on Middle Distillate data of the 2023 Statistical Review of World Energy, produced by the Energy Institute. Notes added by Gail Tverberg.
This squeezing out of non-essential parts of the economy can happen by war, but it can also happen because of financial problems brought about by “not sufficient actual goods and services to go around.” An underlying problem is that governments can print money, but they cannot print the actual resources needed to produce finished goods and services. I think that in the current situation, a squeezing out for financial reasons, or because legislators can’t agree, is at least as likely as another world war.
For example, the US is having trouble electing a Speaker of the House of Representatives because legislators disagree about funding plans. I can imagine a long shutdown occurring because of this impasse. Perhaps not this time around, but sometime in the next few years, such a disagreement may lead to a permanent shutdown of the US central government, leaving the individual states on their own. Programs of the US central government, such as Social Security and Medicare, would likely disappear. It would be up to the individual states to sponsor whatever replacement programs they are able to afford.
[1] An overview of the problem
In my view, we are in the midst of a great “squeezing out.” The economy, and in fact the entire universe, is a physics-based system that constantly evolves. Every part of the economy requires energy of the right types. Humans and animals eat food. Today’s economy requires many forms of fossil fuels, plus human labor. This evolution is in the direction of ever-greater complexity and ever-greater efficiency.
Right now, there is a bottleneck in energy supply caused by too much population relative to the amount of oil of the type used to make diesel and jet fuel (Figure 1). My concern is that many governments and businesses will collapse in response to what I call the Second Squeezing Out. In 1991, the central government of the Soviet Union collapsed, following a long downward slide starting about 1982.
All parts of economies, including government organizations and businesses, constantly evolve. They grow for a while, but when limits are hit, they are likely to shrink and may collapse. The current energy bottleneck is sufficiently dire that some observers worry about another world war taking place. Such a war could change national boundaries and reduce import capabilities of parts of the world. This would be a type of squeezing out of major parts of the world economy. In fact, shortages of coal seem to have set the stage for both World War I and World War II.
Each squeezing out is different. When there are physically not enough goods and services to go around, some inefficient parts of the economy must be squeezed out. Payments to pensioners seem to me to be particularly inefficient because pensioners are not themselves creating finished goods and services.
World leaders would like us to believe that they are in charge of what happens in the world economy. But what these leaders can accomplish is limited by the actual resources that can be extracted and the finished goods and services that can be produced with these resources. When there are not enough goods and services to go around, unplanned changes to the economy tend to take place. These changes work in the direction of allowing parts of the system to go forward, without being burdened by the less efficient portions.
[2] The importance of diesel and jet fuel
Diesel and jet fuel are important to today’s industrial economy because they fuel nearly all long-distance transportation of goods, whether by ship, train, large truck, or airplane. Diesel also powers most of today’s modern agricultural equipment. Without the use of modern agricultural equipment, overall food production would decline drastically.
Without diesel, there would also be many other problems besides reduced food production. Diesel is used to power many of the specialized vehicles used in road maintenance. Without the ability to use these vehicles, it would become difficult to keep roads repaired.
Without diesel and jet fuel, there would also be an electricity problem because transmission lines are maintained using a combination of land-based vehicles powered by diesel and helicopters powered by jet fuel. Without electricity transmission, homes and offices without their own solar panels and batteries wouldn’t be able to keep the lights on. Gasoline pumps require electricity to operate, so they wouldn’t operate either. Without diesel and electricity, the list of problems is endless.
[3] Green energy is itself a dead end, but subsidizing green energy can temporarily hide other problems.
Green energy sounds appealing, but it is terribly limited in what it can do. Green energy cannot operate agricultural machinery. It cannot make new wind turbines or solar panels. Green energy cannot exist without fossil fuels. It is simply an add-on to the current system.
The reason why we hear so much about green energy is because making people believe that a green revolution is possible provides many temporary benefits. For example:
The extra debt needed to subsidize green energy indirectly increases GDP. (GDP calculations ignore whether added debt was used to produce the added goods and services counted as GDP.)
Manufacturers can pretend that their products (such as vehicles) will operate as they do today for years and years.
The educational system is given many more areas to provide courses in.
Citizens are given the hope that the economy will grow endlessly.
Young people are given hope for the future.
Politicians look like they are doing something for voters.
Unfortunately, by the time that the debt comes due to pay for subsidized green energy, it will be apparent that the return on this technology is far too low. The overall system will tend to collapse. Green energy is only a temporary Band-Aid to hide a very disturbing problem. Its impact is tiny and short-lived. And it cannot prevent climate change.
[4] Energy bottlenecks are a frequent problem.
Energy bottlenecks are a frequent problem partly because the human population has tended to increase ever since early humans learned to control fire. At the same time, resources, such as arable land, fresh water supply, and minerals of all kinds, are in limited supply. Extraction becomes increasingly difficult over time (requiring more inputs to produce the same output) because the easiest-to-produce resources tend to be exploited first. Extracting more fossil fuels to meet the energy needs of a growing economy may look like it would be easy, but, in practice, it is not.
As a result of energy bottlenecks, civilizations often collapse. Sometimes war with another group is involved. In such a case, the population of the losing civilization falls.
[5] The standard supply and demand model of economics makes it look like prices will rise in response to fossil fuel shortages. The discussion in Section [4] shows that energy supply bottlenecks often occur. When they do occur, the response is very different.
Figure 2. From Wikipedia: The price P of a product is determined by a balance between production at each price (supply S) and the desires of those with purchasing power at each price (demand D). The diagram shows a positive shift in demand from D1 to D2, resulting in an increase in price (P) and quantity sold (Q) of the product.
The model of many economists is far too simple. Based on the model shown on Figure 2, it is easy to get the idea that a shortage of oil will lead to a rise in prices. As a result, more oil will be produced, and the problem will be solved. Or perhaps efficiency changes, or substitution for a different type of fuel, will fix the problem.
When bottlenecks appear, the real situation is quite different. For example, increases in oil prices tend to cause food prices to rise, and thus increase inflation. Politicians know that citizens don’t like inflation and therefore will not vote for them. As a result, politicians tend to hold down prices. The resulting prices tend to fall too low for producers, and they start producing less, rather than more.
Energy products of the right kinds are essential for making every part of GDP. If there is not enough of the right kinds of energy products to go around, what I call some kind of “squeezing out” is likely to take place. Early on, there may be changes that reduce energy consumption, such as cutbacks in international trade. More businesses may fail. Eventually, some parts of the world economy may disappear, such as the central government of the Soviet Union in 1991. Or war may take place.
[6] When there is not enough energy of the right kinds to go around, spreading what little is available “thinner” doesn’t work.
As an example, if people need to eat 2,000 kilocalories per day, and if the food supply that is available would only supply 500 kilocalories per day (on average), giving everyone the same quantity would lead to everyone starving. Similarly, if a communist government gives every worker the same wage, lateness and “slacking off” become huge problems. Experience in many places has shown that equal pay for all, regardless of native abilities, responsibilities, or effort, simply doesn’t work. Somehow, diligent work and greater responsibility needs to be rewarded.
When an energy bottleneck occurs (leading to too little finished goods and services in total being produced), what I call a “squeezing out” takes place. Such a squeezing out may be initiated in many ways, including a war, angry citizens overturning a government, financial problems, or a shift in climate. The winners in a squeezing out end up ahead; the losers see collapsing institutions of many kinds, including failing businesses and disappearing government organizations.
[7] Most people do not understand the interconnected nature of the world economy, and the way the whole system tends to evolve.
The Universe is made up of many temporary structures, each of which needs to “dissipate” energy to stay away from a cold, dead state. We are all aware that plants and animals behave in this manner, but businesses of all kinds and government organizations also require energy of the right kinds to grow. They get much of their energy from financial payments that act as temporary placeholders for goods and services that will be made in the future using various types of energy, including human labor.
Strangely enough, because of the physics of the situation, business and government organizations are also temporary in nature, and in some sense, they also evolve. In physics terms, all these structures are dissipative structures. Physicist Francois Roddier writes about this broader kind of evolution in his book, The Thermodynamics of Evolution. In fact, economies themselves are dissipative structures. I have written about the economy as a self-organizing system powered by energy many times, including here, here, and here. All these self-organizing structures eventually come to an end.
History is full of records of economies that have collapsed. The book Secular Cycles by Peter Turchin and Serjey Nefedov analyzes eight of these failed economies. Populations tend to grow after a new resource is found or is acquired through war. Once population growth hits what Turchin calls carrying capacity, these economies hit a period of stagflation. This period lasted 50 to 60 years in the sample of eight economies analyzed. Stagflation was followed by a major contraction, typically with failing or overturned governments and declining overall population.
[8] Logic and some calculations suggest that the world economy is likely to be reaching a major downturn, about now.
One way of estimating when a major contraction (or squeezing out) would occur would be to look at oil supply. We know that US oil production hit a peak and started to decline in 1970, changing the dynamics of the world economy. This started a period of stagflation for many of the wealthier economies of the world. Adding 50 to 60 years to 1970 suggests that a major downturn would take place in the 2020 to 2030 timeframe. Since it was the wealthier economies that first entered stagflation, it would not be surprising if these economies tend to collapse first.
There have been several studies computing estimates of when the extraction of fossil fuels would become unaffordable. Back in 1957, Rear Admiral Hyman Rickover of the US Navy gave a speech in which he talked about the connection of the level of fossil fuel supply to the standard of living of an economy, and to the ability of its military to defend the country. With respect to the timing of limits to affordable supply, he said, “. . .total fossil fuel reserves recoverable at not over twice today’s unit cost are likely to run out at some time between the years 2000 and 2050, if present standards of living and population growth rates are taken into account.”
Confusion arises because some people would like to believe that fossil fuel prices can rise to extraordinarily high levels, and this will somehow permit more fossil fuels to be extracted. However, as I discussed in Section [5], the problem is really a two-sided one. Politicians want to hold fossil fuel prices down to prevent inflation, while oil producers (such as those in OPEC+) choose to reduce production if prices are not sufficiently high to meet their needs.
An easily missed point is that tax revenue from the sale of oil is often a large share of the total tax revenue of oil exporting countries. Because of this issue, in order for prices of oil to be adequate for oil exporters, they must include a wide margin for payment of taxes. These taxes are used to support the rest of the economy. For example, in Saudi Arabia, taxes provide support for huge building programs that provide jobs for citizens, but are of questionable long term value. These projects keep citizens happy, at least temporarily. Without adequate subsidy from tax revenue, citizens would want to overturn governments–a form of collapse.
[9] Energy problems are easily hidden because “scientific models” are considered to be important in forecasting the future. These models tend to be misleading because they leave out important elements regarding how the economy really works.
The easiest models to make are the ones that seem to say, “the future will be very similar to the recent past.” These models miss turning points. They assume that growth will continue even though resource extraction can be expected to become more difficult. Some examples of overly simple models include the following:
Money is a store of value. (Not if the economy has stopped functioning properly because insufficient energy resources are available.)
Forecasts of Social Security payments recipients will be able to receive in the future are overstated. (It takes energy of the right kinds to produce the goods and services that the elderly require. If the economy is not producing enough goods and services because of energy extraction limits, the share that pensioners can receive will need to fall so that workers can be paid adequately. Inflation-adjusted benefits to the elderly must be much lower or disappear completely.)
Climate models give high estimates. (These models miss the real-world difficulty of extracting fossil fuels. They also assume the economy can grow indefinitely, greatly overstating future CO2.)
Future energy supply based on “Reserve to Production” ratios give high estimates. (Reserve amounts are often puffed-up numbers to make an oil exporting country look wealthy.)
Energy Return on Energy Invested models greatly overestimate the value of intermittent wind and solar energy. (It is easy to assume that all types of energy are equivalent, but intermittent wind and solar cannot replace diesel and jet fuel.)
[10] Added complexity is not a solution to our energy problems.
Many people believe that if we can just be smarter, we can solve our energy problem. We can add more fuel-efficient engines, more advanced education, and more international trade, for example. Unfortunately, many things go wrong, leading to an upward energy complexity spiral. Difficulties include:
The complexity changes with the best payback tend to be discovered and implemented very early.
Added complexity may lead to higher energy consumption if cost savings result. For example, more vehicles may be sold if reduced fuel consumption makes their operation more affordable to a wider number of users.
Wage disparity results because the wages paid to highly educated employees and those in managerial positions leave little funding available to pay less-skilled workers.
Less-skilled workers indirectly compete with similarly skilled workers in low-wage countries, further holding their wages down.
It is clear that we are now moving past the limits of complexity. For example, international trade as a percentage of GDP has been falling for the world, the US, and China.
Figure 3. Trade as a percentage of GDP based on World Bank data for the World, the United States, and China.
Countries are now actively trying to bring supply lines back closer to home. Trips for goods across the Atlantic and the Pacific Oceans are being reduced, saving diesel and jet fuel.
[11] Repayment of debt with interest acts like a Ponzi Scheme if there is inadequate growth in the energy supply.
Most people today do not realize the extent to which the entire financial system is dependent on growing inexpensive-to-produce energy supply of the right kinds. It takes physical resources of the right kinds to produce goods and services. Resources such as fresh water, copper, lithium, and fossil fuels require more and more energy consumption to produce the same amount of supply because the easiest-to-extract resources are extracted first.
When the economy is far from limits, adding more debt (or other types of promises, such as shares of stock) does seem to increase “demand” for finished goods and services, and this, in turn, tends to increase the production of fossil fuels and other commodities. Thus, for a while, increased debt does indeed increase energy supply.
But when we start reaching extraction limits, instead of producing more fossil fuels and other commodities, higher debt tends to produce inflation. (In other words, more money plus practically the same amount of finished goods and services tends to lead to inflation.) This is the issue central banks are up against today. Central banks raise interest rates in response to the higher level of inflation, partly to compensate lenders for the inflation that is taking place, and partly to make their own economies more competitive in the world economy. The combination of higher interest rates and higher inflation is problematic in many ways:
(a) Ordinary citizens find that they must cut back on discretionary goods and services to balance their budgets. This tends to push economies in the direction of recession and debt defaults. Some citizens find they need to apply for government assistance programs for the first time.
(b) Businesses find it more difficult to operate profitably with higher interest rates and inflation. Businesses increasingly expand in programs supported by government subsidies, such as those for electric cars and batteries, as it becomes increasingly difficult to make a profit without a subsidy. In the US, defaults seem especially likely on commercial real estate loans.
(c) Governments become especially squeezed. Many of them find that their own tax revenue is falling at precisely the time when citizens need their programs most. Governments also find that with higher interest rates, interest costs on their own debt rises. Subsidized programs increasingly seem to be needed to keep the economy operating. The number of retirees also grows year after year. Government debt levels spiral upward, as shown for the US on Figure 6.
With all these issues, the world becomes increasingly prone to war. Political parties, and even groups within political parties, find it increasingly difficult to agree on solutions to problems. The stage seems to be set for an array of worrisome outcomes, including major debt defaults, failing governments, and even widespread war.
[12] The world economy was able to grow rapidly in the 1950 to 1980 period because of a rapid rise in energy consumption. Now, there is an energy bottleneck. The recent increases in interest rates seem likely to burst debt bubbles. They may even squeeze out some major economies with pension programs for their citizens.
Figure 4. Measures of average interest rates of 3-month US Treasury Bills and 10-year Treasury Securities, in a chart produced by the Federal Reserve of St. Louis.
On Figure 4, the significant increases in interest rates up until 1981 corresponded to a huge increase in world energy consumption in the 1950 to 1980 period (Figure 5).
Figure 5. World per capita energy consumption, with the 1950-1980 period of rapid growth highlighted. World Energy Consumption by source, based on Vaclav Smil’s estimates from Energy Transitions: History, Requirements and Prospects (Appendix) together with data from BP’s Statistical Review of World Energy for 1965 and subsequent years. Population estimates used to produce per capita amounts are based on estimates by Angus Maddison for dates prior to 1950. They are based on UN estimates for more recent years. Chart prepared by Gail Tverberg in 2018.
The rapid rise in fossil fuel consumption in Figure 5 was the reason why the economy was able to grow as rapidly as it did in the 1950 to 1980 period. Raising interest rates acted like brakes on the economy and lowered oil prices. The Soviet Union was the economy most harmed by these low oil prices. It also had a communist form of government that did not work well, compared to capitalism. Ultimately, the central government of the Soviet Union collapsed in 1991.
Now, the rise in interest rates during 2022 and 2023 on Figure 4 correspond to a very different situation. Extraction of fossil fuels, and in particular the heavy oil used to produce diesel and jet fuel, is no longer growing rapidly. Instead, what has been growing is debt, especially government debt. Figure 6 shows US government debt through April 2023. US government debt spurted upward in 2020 and is still rising rapidly.
Figure 6. US Public Debt, based on a chart prepared by the Federal Reserve Bank of St. Louis.
The business closures in 2020 and interruptions in travel reduced oil prices and provided a good excuse for more government debt. All this debt added buying power, but it didn’t actually produce very many goods and services. Instead, it added a debt bubble. Similarly, investing in close-to-useless green energy temporarily added GDP, but it mostly added a huge debt bubble. Raising interest rates is likely to burst these debt bubbles.
The US and other rich countries have also put in place pension plans for the elderly. These are not treated as debt, but they depend upon resources of all kinds being available to feed, clothe, and provide shelter to a growing army of retirees. If there is not enough diesel to allow as many goods and services to be produced as are produced today, there is likely to be a huge problem if payouts to pensioners aren’t significantly reduced. Other citizens will be unhappy if retirees get a disproportionately large share of the reduced supply of goods and services. Some will say, “Why work if retirees on pensions get more than those of us who are still working?”
Thus, the world seems to be increasingly in a situation where more squeezing out will take place. Major governments, especially those with pension plans for their citizens, seem especially vulnerable. No one understood that there had been a temporary rapid rise in energy consumption per capita in the 1950 to 1980 period (Figure 5) that led to a temporary spurt in interest rates on bonds. This temporary rise in interest rates made pension programs look far more feasible than they really are for the longterm.
[13] How does the problem resolve itself?
It seems to me that the problem of debt bubbles and of unaffordably generous pension plans is very widespread. Analysts of all kinds have missed the hidden brakes on economies caused by inadequate energy resources of the right kinds, relative to rising populations. Collapse of at least some central governments seems possible. Perhaps some of these collapses can be postponed by rollbacks in government-sponsored programs, particularly those for the elderly and for those who are not working.
But even aside from the pension problem, there is a problem with many debts not being repayable in an economy that is forced to slow, as described in Section [11]. Many other promises become iffy as well. For instance, derivatives may not be able to pay as planned.
If there are problems with inadequate supply of essential materials, they are likely to spill over to asset values. For example, a farm that cannot purchase fuel for its agricultural equipment is, in some sense, not worth very much, since workers with simple tools like shovels cannot produce very much food. Likewise, a factory with permanently broken supply lines is not worth much.
I wish I could provide a happy-ever-after ending. The closest I can come to such an ending is to say that it appears to me that there is a literal Higher Power that is somehow providing an enormous amount of energy in a way that allows the Universe to continually expand. This literal Higher Power is, in some way, influencing the world today, through the self-organizing nature of the economy. The book Rare Earth: Why Complex Life Is Uncommon in the Universe, by Ward and Brownlee, explains that life could not have happened on the Earth, as quickly as it did, by chance alone. Perhaps things will turn out differently than we expect.
I was recently asked to be a keynote speaker for World Management Conference (WMC 2023) in Patna, India. The academic group that asked me to speak was particularly concerned about Complexity and Sustainability. A PDF copy of the presentation is available at this link.
The primary things I pointed out to the group were the following:
The slower the growth, the more sustainable an economy is over the moderately long term.
Energy consumption and the use of complexity tend to rise together.
Too much complexity can lead to collapse.
In general, the most “efficient” economies can be expected to do best.
Over the long term, all economies will collapse.
There have been shifts in which economies get a major share of available energy supplies. Shifting patterns are likely again in the future.
India may come out ahead in an energy squeeze because its warm climate and conservative culture allow its energy consumption per capita to remain low.
Figure 1. Share of total world energy consumption, by country grouping, based on data of the 2023 Statistical Review of World Energy by Energy Institute. Russia+ includes Russia and its close affiliates. For the earliest years, these were data for the Soviet Union. For more recent years, the grouping is for the Commonwealth of Independent States.
A great deal of my presentation was simply a restatement of the words on the slides, in a slightly different way. So, my comments on the slides will be quite brief.
Slide 1.Slide 2.Slide 3.
Of course, after complexity solves problems, population continues to grow, creating a similar problem all over again. This likely leads to the need for even more complexity.
Slide 4.
My crude drawing represents the difference between slow growth in population and fast growth in population. Rapid growth is difficult to sustain for very long because arable land and fresh water don’t grow.
There is a similar problem if fossil fuel energy is being used. If growth in consumption is very fast (for example, China’s growth pattern starting in 2002), it becomes impossible to keep up the pattern. There can be two different problems: (a) Running short of fuels, leading to the need for higher-cost extraction and/or imports, and (b) Overpromising in the financial markets, leading to debt defaults and stock market crashes. China seems to be encountering both difficulties, even though its population is falling, rather than growing.
Slide 5.
Organizing workers to plant and harvest crops represented a major step up in complexity, relative to hunting and gathering.
A metal tool, such as the one shown on Slide 5, greatly helped the productivity of farmers compared to using a sharpened rock or a piece of wood as a tool, or using only bare hands.
Slide 6.Slide 7.Slide 8.
Of course, this list of uses is very incomplete. For example, both coal and natural gas are burned to create electricity.
Slide 9.Slide 10.Slide 11.Slide 12.
As an example of a) above, a metal shovel allows more food to be grown. Food is, of course, an energy product that humans eat. Another example would be better drilling approaches that allow more oil to be extracted from a well.
Regarding b), greater complexity makes cars more fuel-efficient cars, making the cars less expensive to operate. This makes them more affordable, so more people can afford to buy them. This is known as Jevons’ Paradox. Although the devices look more efficient, the fact that more people can afford them allows the total amount of fuel used to increase.
Item c) relates to adding “buying power.” If more people can afford goods because of more government spending or more government debt, the added buying power keeps the demand, and thus the prices, of energy products up higher than they otherwise would be. The higher prices motivate businesses to extract harder-to-access energy resources that might not be profitable to extract if the prices were lower.
Slide 13.
We extract the least expensive to extract oil, coal, or natural gas first. Even if our techniques get better, at some point, the price of fossil fuels used in growing and transporting of food becomes unreasonably high. Poor people, especially in low-income countries, have a hard time affording an adequate diet.
Slide 14.
Slide 14 shows a chart I put together to try to explain the physics-based way economies are built. In a way, they are built in layers, with new businesses being added at the top, over old businesses, and new laws being added to old sets of laws. New human customers are added, too, and some die or move away.
Every action that contributes to GDP requires energy of some kind. It could be human energy powered by food, or human energy plus fossil fuel powered energy. Moving a truck or train requires energy. Even moving electrons, as in heating food or transferring electrons within transmission lines, takes energy.
One thing that keeps the system in balance is the fact that many of the consumers are also employees. If wages are not high enough (particularly for the poorer members of the economy), it becomes increasingly difficult for them to afford the basic goods and services that they need for living. Of course, changing interest rates or the availability of credit also affects the affordability of goods and services.
Slide 15. Hand drawn chart by Gail Tverberg showing some of the processes that change as an economy gradually grows too big and too complex for its resource base.
Early in the life of the economy, both energy consumption and complexity rise, as depicted in The Energy-Complexity Spiral by Joseph Tainter, illustrated on Slide 12,
At some stage, the economy reaches a point of too much wage and wealth disparity. Poor people cannot afford the necessities of life. Riots by poor people become common, as they did about 2018 and 2019, indirectly because of low wages and low benefit levels. Governments find ways to make goods more affordable, as many did in 2020 (partly by ramping up money supply and partly by limiting travel, thereby reducing oil demand and thus oil prices).
As the economy tries to bounce back, inflation and broken supply lines can become problems, as they did in 2021. More fighting tends to take place, as it did with the Ukraine conflict beginning in 2022. In some ways, the economy begins to sound like the book Nineteen Eighty-Four by George Orwell, with a great deal of censorship of opinions not conforming to government-sponsored views.
If the problem really is a resource problem that cannot be fixed with more complexity, the high level of wage disparity will ultimately lead to the population falling because poor people cannot afford necessities. Large cities are particularly prone to collapse. GDP can be expected to fall at the same time.
Slide 16.Slide 17.
Politicians cannot admit that such a problem might be lying ahead because they want to be reelected. Educators want students to think that high-paying jobs for people with advanced education will continue to be available in the future. Businesses want people to believe that the cars and homes that they are purchasing will be worthwhile investments for many years in the future. Mainstream media has no choice but to tell the stories governments and businesses want told. Governments offer research grants on projects associated with the favored technologies, giving financial incentives to publish academic papers supporting the chosen narrative.
The whole process is assisted by the fact that academic areas within universities each seem to exist within their own ivory towers. Researchers within economics departments don’t understand that there is a physics reason for the world’s high energy consumption; “scientific modelers” don’t understand the limits of a finite world. Scientific modelers assume that growth can happen indefinitely, while both history and physics indicate that this is impossible.
Slide 18.Slide 19.
The chart shown on Slide 19 is a repeat of Figure 1, shown at the beginning of this post. In this chart, the Organisation for Economic Co-operation and Development (OECD) is an organization of 37 rich countries of the world, including the US, Canada, most of the countries of Europe, Japan, Australia, and New Zealand. Its energy consumption clearly has been squeezed down since 2002, when China’s energy consumption started rising after it joined the World Trade Organization (WTO) in December 2001.
As mentioned on Slide 18, the share of world energy consumption of Russia (+ closely affiliated countries) has been squeezed back for a very long time. This may be part of the reason why Russia seems to be so unhappy.
India’s share of world energy consumption is small, but it has been growing.
The share of energy consumption by countries in the Rest of the World has also been growing. This group would include OPEC countries, plus the many poor countries around the world.
Slide 20.
In item 4 on Slide 20, regarding vehicles being small, I mean that motorcycles, 3-wheeled auto rickshaws, and mini trucks are used to a much greater extent in India than in the richer countries of the world.
Slide 21.
It might be mentioned that China’s per-capita energy consumption is now almost as high as that of Europe. At the time it joined the WTO in 2001, China’s energy consumption per capita was only about 25% of high as that of Europe. China would now seem to be in danger of having its share of world energy consumption squeezed back because it is itself becoming relatively rich.
Slide 22.
The chart shows that India’s oil consumption has been rising, while its oil production has been trending downward for about a decade. Imports make up the difference. In an oil-constrained world, the question is whether oil imports will really continue to be available at an affordable price. Diesel and jet fuel are in particularly short supply.
Slide 23.
India, like pretty much everywhere else in the world, gets the vast majority of its energy supply from fossil fuels. Using the Energy Institute’s (EI’s) way of counting, about 88% of India’s energy consumption in 2022 came from fossil fuels.
It is confusing to know how to count wind and solar because their electricity is not available when needed. If they are given credit as if they provide dispatchable electricity (which is EI’s approach), then their combined percentage is 6%. If wind and solar are counted as only replacing fuel, then their combined share of energy supply is about 2% or 3% in 2022. The International Energy Agency (IEA) uses the approach providing the lower indications, as do many researchers.
Slide 24.
When an economy starts shrinking, as shown in Slide 15, there is a problem with supply lines breaking in an overly complex society. Much of the world experienced some broken supply lines in 2020 and 2021. We can expect more broken supply lines again in future years.
Supply lines are likely to get shorter because of the shortages of diesel and of jet fuel. In particular, fewer goods and services are likely to be shipped across the Atlantic or Pacific Ocean. More trade will be regional in nature. For example, India will probably have a larger share of its total trade with other countries of Southeast Asia than now.
We can expect more fighting among countries because the world will basically be in a situation of “not enough to go around.” India would do well to stay out of these wars.
Intermittency of electrical supply will likely become more of a problem in the future. Replacement parts after storms will be more difficult to obtain.
Slide 25.Slide 26.Slide 27.Slide 28.Slide 29.
It is tempting for high energy economies to forget the importance of traditions and religion. Religions help bind groups together. Their laws and traditions give people a way to live with one another, without having a huge army of police being hired to keep order.
As economies become richer, the belief tends to become: The government can save us from all problems. We no longer need our traditional beliefs. All we need to do is focus on more even distribution of goods and services.
Unfortunately, the economy doesn’t work this way. Governments can print money, but they can’t print additional food and water. With broken supply lines, essential commodities such as fertilizer become unavailable. Population must drop for the economies to get back in balance. This is the reason that wars become more frequent, as complexity limits are hit.
For many years, there has been a theory that imports of oil would become a problem before there was an overall shortage of fossil fuels. In fact, when I look at the data, it seems to be clear that oil imports are already constrained.
Figure 1. Interregional trade of fossil fuels based on data of the 2023 Statistical Review of World Energy by the Energy Institute.
As I look at the data, it appears to me that coal and natural gas imports are becoming constrained, as well. There was evidence of this constrained supply in the spiking prices for these fuels in Europe in late 2021 and early 2022, starting well before the Ukraine conflict began.
Oil, coal, and natural gas are different enough from each other that we should expect somewhat different patterns. Oil is inexpensive to transport. It is especially important for the production of food and for transportation. Prices tend to be worldwide prices.
Coal and natural gas are both more expensive to transport than oil. They tend to be used in industry, in the heating and cooling of buildings, and in electricity production. Their prices tend to be local prices, rather than the worldwide price we expect for oil. Prices for importers of these fuels can jump very high if there are shortages.
In this post, I first look at the trends in the overall supply of these fuels, since a big part of the import problem is fossil fuel supply not growing quickly enough to keep pace with world population growth. I also give more background how the three fossil fuels differ.
After this introductory material, I provide charts and some analysis of fossil fuel imports and exports by region, based on data from the 2023 Statistical Review of World Energy. Theoretically, the total of regional imports should be very close to the total of regional exports. This analysis gives a little more insight into what is going wrong and where.
[1] On a worldwide basis, total supplies of both oil and coal seem to be constrained.
Figure 2. World consumption of oil, coal, and natural gas based on data of the 2023 Statistical Review of World Energy by the Energy Institute.
Figure 2 shows that world supplies of all three fossil fuels follow the same general pattern: They tend to rise in close to parallel lines, with oil supply on top, coal next, and natural gas providing the least supply.
The total supply of fossil fuels needs to be shared by the world’s population. It therefore makes sense to look at supply on a per capita basis.
Figure 3. World per capita consumption of oil, coal, and natural gas, based on data of the 2023 Statistical Review of World Energy by the Energy Institute.
On Figure 3, the top line, oil supply per capita, is almost perfectly level, suggesting that having a greater supply of oil enables having a larger world population. This relationship makes sense because oil is used to a significant extent in growing today’s food, and shipping it to market. Oil products also make herbicides, insecticides, and drugs for animals that enable the growing supply of food needed to feed today’s population. Oil products are also helpful in road making, and in providing lubrication for machinery of all kinds.
We might conclude that oil supply is essential to the growth of human population. It is only by way of a huge change in the economy, such as the one that took place in 2020, that there is a big dip in oil usage. Even now, some of the changes are “sticking.” Some people are continuing to work from home. Business travel is still low. People are still not buying fancy clothing as much as before 2020. All these things help reduce fossil fuel usage, particularly oil usage.
Figure 3 also shows that on a per capita basis, coal supply has fallen by 9% since its peak in 2011. This fact, plus the fact that coal prices have been spiking around the world in recent years, leads me to believe that coal supply is already constrained, even apart from the export issue.
[2] The share of oil traded interregionally is more than double the share of coal or natural gas traded interregionally.
The reason why oil is disproportionately high in Figure 1 compared to Figure 2 is because a little over 40% of oil is shipped between regions. In comparison, only about 18% of coal production is traded with other regions, and about 17% of natural gas production is shipped interregionally. Oil is much easier (and cheaper) to transport between regions than either coal or natural gas. Shipping costs tend to escalate rapidly, the farther either natural gas or coal is shipped.
Natural gas has a second problem over and above the high cost of shipping: It requires storage (which may be high cost) if it is not used immediately. Storage is needed for both natural gas and coal because both fuels are often used for heat in winter, either by direct burning or by creating electricity that can be used to heat buildings. Storage for coal is close to free because it can be stored in piles outside.
Besides heat in winter, coal is also used to provide electricity for air conditioning in summer, so its demand curve has peaks in both summer and winter. Natural gas is much more of a winter-heat fuel in the US, so it has a large peak corresponding to winter usage (Figure 4).
Figure 4. Coal and natural gas consumption by month based on data of the US Energy Information Administration.
Storage for natural gas needs to be available in every area where users expect to use it for winter heat. The cost of this storage will be low if there are depleted natural gas caverns that can be used for storage. It is likely to be high if above ground storage is required. Natural gas importing areas often do not have suitable caverns for storage. The easy approach is to try to get by with a bare minimum of storage, and hope that imports can somehow make up the difference.
The big question for any fuel is, “Can consumers afford to pay a high enough price to cover all the costs involved in getting the fuel from endpoint to endpoint, at the time it is needed?“
Citizens become very unhappy if the cost of winter heat becomes extremely expensive. They demand subsidies and rebates from the government, in order to keep costs down. This is a sign that prices are too high for the consumer.
Both coal and natural gas are also heavily used in manufacturing. Their prices vary greatly from location to location and from time to time. If coal or natural gas prices rise in a particular location, the cost of manufactured goods from that location will also tend to rise. These higher prices will particularly hurt a manufacturing country, such as Germany, because its manufactured goods will become less competitive in the world marketplace. GDP growth will be reduced, and the profitably of manufacturers will tend to fall.
Because of these issues, long-distance trade in both coal and natural gas tend to hit barriers that may be difficult to see simply by looking at the trend in world production.
[3] Natural gas exports may already be becoming constrained, even though the total amount extracted still seems to be rising.
A huge amount of investment is needed to make long-distance sale of natural gas possible. Such investment includes:
The cost of developing a natural gas field for export use, usually over many years.
Pipelines covering every inch traveled by the natural gas, other than any portion of the trip for which transfer as liquefied natural gas (LNG) is planned.
Special ships to transport the LNG.
Facilities to chill natural gas, so it can be shipped overseas as LNG.
Regasification plants, to make the natural gas ready to ship by pipeline after it has been transferred as LNG.
Storage facilities, so that sufficient natural gas is available for winter.
Not all of these investments are made by the same organizations. They all need to provide an adequate return. Even if “only” very long-distance pipelines are used, the cost can be high.
Pipelines work best when there is no conflict among countries. They can be blown up by another country that seeks to raise natural gas prices, or that wants to retaliate for some perceived misdeed. For this reason, most growth in natural gas exports/imports in recent years has been as LNG.
Organizations investing in high-cost infrastructure for extracting and shipping natural gas would like long-term contracts at high prices in order to cover their costs. Without a stable long-term supply contract, natural gas purchase prices can be extremely variable. Japan has tended to buy LNG under such long-term contracts, but many other countries have taken a wait-and-see attitude toward prices, hoping that “spot” prices will be lower. They don’t want to lock themselves into a long-term high-priced contract.
There are two different things that tend to go wrong:
Spot prices bounce up above even what the long-term contract price would have been, creating a huge high-price problem for consumers.
Spot prices, on average, turn out to be too low for natural gas exporters. As a result, they cut back on investment, so that the amount of future exports can be expected to fall.
I believe that there is a significant chance that natural gas exports are now reaching a situation where prices cannot please all users simultaneously. Not all investors can get an adequate return on the huge investments that they have made in advance. Some investments that should have been made will be omitted. For example, there might be enough natural gas storage for a warm winter, but not for a very cold winter in Europe.
A prime characteristic of a fossil fuel (or any resource) that is not economic to extract is that the industry has difficulty paying its workers an adequate wage. Recently, there has been news about a union strike against Chevron at an Australian natural gas extraction site used to provide gas for liquefied natural gas (LNG) export. This suggests that natural gas may already be hitting long-distance export limits. Prices can’t stay high enough for producers to pay their workers an adequate wage.
[4] Oil imports by area suggest that the rapidly growing manufacturing parts of the world are squeezing out the imports desired by high-wage, service-oriented countries.
Because oil is so important in international trade, I looked at the amounts two ways. The first is based on trade flows, as reported by the Energy Institute:
Figure 5. Oil imports by area based on the 2023 Statistical Review of World Energy by the Energy Institute.
The second is based upon a comparison of reported production and consumption for the same year, using the assumption that if consumption is higher than production, the difference must be attributable to imported oil. The problem with this later approach is that it can easily be distorted by changes in inventory levels. There may also be difficulties with my approach of netting out flows in two different directions, especially if the flows are partly of crude oil and partly of “oil products” of various types.
Figure 6. Oil imports based on production and consumption data of the 2023 Statistical Review of World Energy by the Energy Institute. Amounts adjusted to include “Refinery Gain,” as reported by the US Energy Information Administration.
In both charts, imports for China, India, and Other Asia Pacific are clearly much higher in recent years, while imports for the US, Japan, and Europe are down. The peak year for imports (in total) was about 2016 or 2017. Imports were about 3.5 million barrels a day lower in 2022, compared to peak, with both approaches.
[5] Oil imports by area indicate that nearly all oil exporters around the globe are having difficulty maintaining export levels.
Here, again I show two indications, using the same methods as for oil imports. Since trade is two sided, I would expect total import indications to more or less equal the total of all amounts exported.
Figure 7. Oil exports by area using trade flows based on data of the 2023 Statistical Review of World Energy by the Energy Institute.
On Figure 7, peak oil exports (in total) occur in 2016, with the runner up year being 2017. US oil exports are shown to be nearly zero, even in recent years, because US imports and US oil exports more or less cancel out.
Figure 8. Oil exports based on production and consumption data of the 2023 Statistical Review of World Energy by the Energy Institute. Amounts adjusted to include “Refinery Gain,” as reported by the US Energy Information Administration.
The indications of Figure 8 show that apart from Canada, the amount of oil exported for all the other export groupings shown is lower in recent years than it was a few years ago. This is also evident in Figure 7, but not as clearly.
To some extent, the lower production in recent years is related to the cutbacks announced by OPEC+ (including what I call Russia+). While these cutbacks are “voluntary,” they reflect the fact that based on current oil prices, and based on investments made in recent years, these countries have made the decision to cut back production. No oil exporter would dare mention that it is running short of oil that can be extracted without considerably more investment.
On Figures 7 and 8, “Mexico+South” refers to all the oil being produced from Mexico southward. Besides Mexico, this includes Brazil, Venezuela, Argentina, Columbia, Ecuador, and a number of other small producers. Most of them are experiencing falling production. Brazil is doing a bit better, but it does not seem to be experiencing much growth in exports.
Africa’s peak year for oil exports seems to have been in 2007 (both approaches), with recent exports at a much lower level.
With respect to Russia+, its exports seem to be down from their peak in 2017 or 2018, but not any more than for oil producers from the Middle East. The European Union oil embargo doesn’t seem to have had much of an impact.
The star performer seems to be Canada, with its rising production and exports from the Canadian Oil Sands.
In this analysis, I have “netted out” imports and exports. On this basis, the US hasn’t moved into significant oil exporter status yet. I am sure that there are some people hoping that the oil production of the US will continue to increase, but whether this will happen is unclear. The growth of US oil production in recent years has helped offset (and thus hide from view) the falling exports of many countries around the world.
[6] Coal exports appear to have peaked about 2016. Europe has reduced its imports of coal, leaving more for other importers.
Figure 9. Coal imports by area using trade flows based on data of the 2023 Statistical Review of World Energy by the Energy Institute.
The peak in coal imports seems to have occurred about 2016. In particular, Europe’s imports of coal have fallen significantly since 2006. At the same time, coal imports have risen for many Asian countries, including China, India, South Korea, and Other Asia Pacific. Even Japan seems to have been able to obtain a fairly consistent level of coal imports for the 22-year period shown on Figure 9.
Figure 10. Coal exports by area based on trade flow data from the 2023 Statistical Review of World Energy by the Energy Institute.
One thing that is striking about coal exports is that they are disproportionately from countries in the Far East. Even the coal exports of the US and Canada are from North America’s West Coast, across the Pacific. Russia’s coal exports tend to be from Siberia.
The coal exports of South Africa have declined significantly since 2018, and other African countries are eager for their imports. Today’s largest source of coal exports is Indonesia. Coal exports from Russia+, at least until 2021, have been been a source of coal export growth.
A major share of the delivered price of coal is transportation cost, which tends to be fueled by oil, particularly diesel. Overland transit is particularly expensive. The real reason for Europe’s decline in coal imports since 2006 (shown in Figure 9) may be that there are practically no affordable coal exports available to it because it is too geographically remote from major exporters. Of course, this is not a story politicians care to tell voters. They prefer to spin the story as Europe’s choice, to prevent climate change.
[7] Natural gas imports and exports have only recently started to become constrained.
Figure 11. Natural gas exports by area based primarily upon production and consumption data from the 2023 Statistical Review of World Energy by the Energy Institute.
Figure 11 shows that natural gas exports from Russia+ (really Russia, with a little extra production from other countries in the Commonwealth of Independent States) have stayed fairly level, except for a big drop-off in 2009 (probably recession related) and in 2022.
The overall level of natural gas exports has been rising because of contributions from several parts of the world. Africa was an early producer of natural gas exports, but its exports have been dropping off somewhat recently as local gas consumption rises.
More importantly, exports have increased in recent years from the Middle East, Australia, and North America. With this growing supply of exports, it has been possible for importers to increase their imports.
Figure 12. Natural gas imports by area based upon production and consumption data from the 2023 Statistical Review of World Energy by the Energy Institute.
Europe was able to maintain a fairly stable level of natural gas imports between 1990 and 2018, and even to increase them by 2021. China was able to ramp up its natural gas imports. Even Japan was able to ramp up its natural gas imports until about 2014. It has tapered them back since then. India and Other Asia Pacific both have been able to add a small layer of imports, too.
[8] What lies ahead?
The countries that have the greatest advantage in using fossil fuel imports are the countries that don’t heat or cool their homes, and that don’t have large numbers of private citizens with private passenger automobiles. Because of their sparing use of fossil fuel imports, their economies can afford to pay higher prices to import these fossil fuel imports than other countries. Thus, they are likely to be winners in the competition for fossil fuel imports.
Europe stands out to be an early loser of imports. It is already losing oil and coal imports, and it also seems to be an early loser of natural gas imports. However, for all its talk about preventing climate change, the reduction in European imports of fossil fuels hasn’t made much of a dent in global carbon dioxide emissions (Figure 13).
Figure 13. CO2 emissions for Europe and the Rest of the World, based on data of the 2023 Statistical Review of World Energy by the Energy Institute.
I am afraid that no country will really come out ahead. In some sense, the United States is better off than many countries because it is producing slightly more fossil fuels than it consumes. But it still depends on China and other countries for many imported goods, including computers. Given this situation, the United States likely cannot continue business as usual for very long, either.
It has recently become clear to me that heavy oil, which is needed to produce diesel and jet fuel, plays a far more significant role in the world economy than most people understand. We need heavy oil that can be extracted, processed, and transported inexpensively to be able to provide the category of fuels sometimes referred to as Middle Distillates if our modern economy is to continue. A transition to electricity doesn’t work for most heavy equipment that is powered by diesel or jet fuel.
A major concern is that the physics of our self-organizing economy plays an important role in determining what actually happens. Leaders may think that they are in charge, but their power to change the way the overall system works, in the chosen direction, is quite limited. The physics of the system tends to keep oil prices lower than heavy oil producers would prefer. It tends to cause debt bubbles to collapse. It tends to squeeze out “inefficient” uses of oil from the system in ways we wouldn’t expect. In the future, the physics of the system may keep parts of the world economy operating while other inefficient pieces get squeezed out.
In this post, I will try to explain some of the issues with oil limits as they seem to be playing out, particularly as they apply to diesel and jet fuel, the major components of Middle Distillates.
[1] The most serious issue with oil supply is that there seems to be plenty of oil in the ground, but the world economy cannot hold prices up sufficiently high, for long enough, to get this oil out.
As I frequently point out, the world economy is a physics-based system. World oil prices are set by supply and demand. Demand is quite closely tied to what people around the world can afford to pay for food and for transportation services because the use of oil is integral to today’s food production and transportation services.
Heavy oil is especially involved in this affordability issue. As oil becomes “heavier,” it becomes more viscous, and thus more difficult to ship by pipeline. If oil is very heavy, as is the oil from the Oil Sands of Canada, it needs to be mixed with an appropriate diluent to be shipped by pipeline.
Heavy oil often has sulfur and other pollutants mixed in, adding costs to the refining process. Furthermore, heavy oil, especially very heavy oil, often needs to be “cracked” in a refinery to provide a desirable mix of end products, including diesel, jet fuel, and gasoline. This, too, adds costs. Otherwise, there would be too much of the product mix that would be like asphalt. Also, as noted previously, even if the costs of production are high, the selling price of diesel cannot rise very high without raising food prices. This tends to keep the prices of heavy crude oils below those for lighter crude oils.
Many people believe that the high level of “Proved Oil Reserves” worldwide makes it certain that businesses can extract as much oil as they would like in the future. A major issue is whether these reserves mean as much as people assume they do. Oil reserves of OECD countries (an association of the US and other rich countries) are likely to be audited, but reserves of other countries may not be. Asking a relatively poor oil-exporting country the amount of its oil reserves is like asking the country how wealthy it is. We should not be surprised by fibbing on the high side. The problem is that the vast majority of reported oil reserves (85%) are held by non-OECD countries. These reserves may be significantly overstated.
Also, even if the reserves are fairly reported, will the country have the resources to extract these reserves? Venezuela reports the highest oil reserves in the world thanks to its heavy oil in the Orinoco Belt, but it extracts a relatively small amount per year. An October 2022 article says that the country is waiting for foreign investment to expand production.
Going forward, oil companies everywhere need to worry about broken supply lines for necessary items, such as steel drilling pipe. They need to worry about finding enough trained workers. They need to worry about the availability of debt and the interest rate that will be charged for this debt. If private oil companies look at the true prospects and find them too bleak, they will likely use their profits to buy back the shares of their own oil companies instead (as is happening now).
[2] While oil producers can crack heavy oil to make shorter hydrocarbons in a way that is not terribly expensive, trying to make near-gasses and light oils into diesel becomes impossibly expensive.
It is easy for people to assume that any part of the oil mix is substitutable for another part, but this is not true. Cracking long hydrocarbon chains works to make shorter chains, but the economics tend not to work in the other direction. Thus, it is not economically feasible to make gasoline into diesel (which is heavier), or natural gas liquids into diesel.
[3] If there is inadequate oil supply, the impacts on the economy are likely to include broken supply lines, empty shelves, and inflation in the price of goods that are available.
If there is not enough oil to go around, some users must be left out. The result is that some of the less profitable consumers of oil may file for bankruptcy. For example, the Wall Street Journal recently reported Trucking Giant Yellow Shuts Down Operations. This bankruptcy makes it impossible for some stores to get the merchandise that would normally be on their shelves. As a consequence, it makes it likely that some replacement parts for automobiles will not be available when needed. There is a workaround of renting another vehicle while a person’s car is waiting for repairs, but this adds to total costs.
This workaround illustrates how a lack of adequate oil can indirectly lead to higher overall costs, even if the oil itself is not higher-priced. The need to work around supply line problems tends to lead to inflation in the prices of goods that continue to be available.
[4] The fact that the quantity of oil that could be affordably extracted was likely to fall short about now has been known for a very long time, but this fact has been hidden from the public.
In 1957, Hyman Rickover of the US navy predicted that the amount of affordable fossil fuels would fall short between 2000 and 2050, with the amount of oil falling short earlier than coal and natural gas.
The book The Limits to Growth by Donella Meadows and others, published in 1972, discusses the result of early modeling efforts with respect to resource limits. These resource limits were very broadly defined, including minerals such as copper and lithium in addition to fossil fuels. A range of indications were produced, but the base model (based on business as usual) seemed to show limits hitting before 2030 (Figure 1).
Figure 1. Base scenario from the 1972 book, The Limits to Growth, printed using today’s graphics by Charles Hall and John Day in “Revisiting Limits to Growth After Peak Oil.”
Since the resource limits include minerals of all types, these limits would seem to preclude a transition to clean energy and electric cars.
Educators, advertisers, and political leaders could see that discussing the oil problem would cause economic suicide. What would be the point of buying a car, if a person couldn’t use it for very long? Educators felt that students needed to be guided in the direction of hoped-for solutions, no matter how remote they might be, if university programs were to remain open.
Politicians and government officials wanted to keep voters happy, so the self-organizing economy pushed them in the direction of keeping the story from the public. They tended to focus on climate issues instead. They added biofuels to stretch the supply of gasoline, and to a lesser extent, diesel. They also increased the share of natural gas liquids. The selling price of these liquids tends to be quite low, relative to the price of crude oil.
They started providing reports showing “all liquids” rather than “crude oil,” in the hope that people wouldn’t notice the change in mix.
Figure 2. World “total liquids” production by type, based on international data from the US EIA.
[5] The world’s number one problem today seems to be an inadequate supply of Middle Distillates. These provide diesel and jet fuel.
Diesel and jet fuel provide the big bursts of power that commercial equipment requires. Many types of equipment are dependent on Middle Distillates, including semi-trucks, agricultural equipment, ocean-going ships, jet planes, road-making equipment, school buses, and trains operating in areas with steep inclines.
Because of its concentrated store of energy, diesel is also used to operate backup generators and to provide electricity in remote areas of the world where it would be impractical to have year-round electricity without an easily stored fuel.
Figure 3. World oil consumption by product type based on “Regional Consumption” data from the 2023 Statistical Review of World Energy, published by the Energy Institute. Oil includes natural gas liquids.
In Figure 3:
Light Distillates are primarily gasoline (78% in 2022).
Middle Distillates are diesel (82%) and jet fuel/kerosene (18%).
Fuel Oil is a cheap, polluting, unrefined product. If environmental laws permit, it can be burned as bunker fuel (used in ships), as boiler fuel, or to provide electricity.
The Other category includes near-gasses such as ethane, propane, and butane (58%). It also includes some very heavy oil used as lubricants, asphalt, or feedstocks for petrochemicals.
Until recently, it has been possible to increase diesel production by refining an added share of Fuel Oil. Fuel oil is quite heavy (barely a liquid), so it is well-suited to be refined into a mix that includes a large share of Middle Distillates.
Now we are running short of Fuel Oil to refine for the purpose of producing more Middle Distillates. The Fuel Oil that is still consumed is used in what I think of as the poorer countries of the world: the non-OECD countries (Figure 4).
Figure 4. World Fuel Oil consumption split between OECD (rich countries) and Non-OECD (poor countries) from the 2023 Statistical Review of World Energy, published by the Energy Institute.
Poor countries tend to value “low price” over “prevents pollution.” It is likely to be difficult to get these countries to move away from the use of Fuel Oil.
[6] Countries around the world are now competing for Middle Distillates to maintain the food production, road building, commercial transportation, and construction portions of their economies.
Figure 5. World per capita consumption of Middle Distillates and Light Distillates based on “Regional Consumption” data from the 2023 Statistical Review of World Energy, published by the Energy Institute.
Figure 5 shows that since about 1983, consumption per capita for both Light Distillates and Middle Distillates has been generally slightly growing. Growth in usage tends to be higher for Middle Distillates than Light Distillates. The total quantity consumed is also higher for Middle Distillates.
The dip in consumption per capita in 2020 is much more pronounced for Middle Distillates than Light Distillates. For Middle Distillates, the change from 2018 to 2020 is -16%; the change from 2018 to 2022 is -7%. The corresponding changes for Light Distillates are -11% and -4%.
The difference in patterns in Light Distillates and Middle Distillates is not surprising: Gasoline, the main product of Light Distillates, has been the focus of efficiency changes. It is also possible to dilute gasoline with ethanol, made from corn. Voters in the US are particularly aware of gasoline availability and price, so politicians tend to focus on it.
Diesel and jet fuel, made using Middle Distillates, are less on the minds of voters, but they are probably more important to the economy because people’s jobs depend upon the economy in its current form holding together. Inadequate Middle Distillates leaves empty shelves in stores because of broken supply lines. It also leads to inflation of the type we have recently been experiencing. Indirectly, lack of Middle Distillates can lead to debt bubbles collapsing, and to problems of a different type than inflation.
Figure 6. Middle Distillate consumption for OECD and non-OECD countries, based on “Regional Consumption” data from the 2023 Statistical Review of World Energy, published by the Energy Institute.
Up until 2007, Middle Distillate consumption was generally increasing for both OECD countries and non-OECD countries. The Great Recession of 2008-2009 particularly affected OECD countries. European countries found their economies doing less well. For example, less diesel was used to operate tour boats carrying tourists; a larger share of available jobs were low-paid service jobs.
The year 2013 was a turning point of a different type. The consumption of non-OECD countries caught up with that of OECD countries. While non-OECD countries might like to maintain their rapid upward trajectory in the consumption of Middle Distillates, this no longer seems to be possible.
[7] Under the Maximum Power Principle, the physics of the economy pushes the economy toward optimal low-cost solutions, especially as the quantity of Middle Distillates approaches limits.
The economy, like every other ecosystem, operates under the principle of “survival of the best adapted.” In terms of the sale of goods, this means that the lowest-priced goods will tend to win out in a competitive environment, provided that they are of adequate quality and that the makers can earn an adequate profit in making them.
Furthermore, the makers of the goods must earn a high enough profit both for reinvestment and to pay adequate taxes to their governments. Payments of taxes to governments are essential; otherwise governmental collapse would occur due to the growing debt that cannot be repaid.
If inflation becomes a problem, rising interest rates would tend to push governments with large amounts of debt toward collapse because they would become unable even to make interest payments from current income.
In this self-organizing economy, buyers of goods don’t know or care much about the lives of the workers in the system. Optimal low costs of manufacturing in a world market might mean:
Manufacturers have access to very inexpensive energy sources and use them.
Pollution control is ignored to the maximum extent possible, without serious harm to the workers.
Governments provide very little in the way of benefits to citizens, such as health care or pensions, keeping the cost of government low.
Workers can get along on relatively low salaries because little heating or cooling of homes is needed.
Workers don’t expect private vehicles, recreational activities, or advanced medical care.
Because the economy favors the lowest cost of profitable production, a person would expect that warm countries that use oil sparingly in their energy mix (India, the Philippines, and Vietnam, for example) would have a competitive edge over other countries in manufacturing.
In general, a person would expect non-OECD countries to outcompete OECD countries, especially if cheap fuel for manufacturing is available. The lack of cheap fuel is increasingly becoming a problem in many parts of the world. Coal used to be cheap, but its price can now spike. Natural gas prices can also spike, especially if natural gas is purchased without a long-term contract. Electricity using wind and solar tends to be high-priced, too, when the cost of transmission is included.
[8] The Maximum Power Principle seems to be pushing the EU away from diesel.
The EU has a serious oil problem. It has essentially no crude oil production of its own. Furthermore, oil production in Europe outside of the EU (mainly the UK and Norway) has been falling since 1999, greatly reducing the possibility of imported oil from this area (Figure 7).
Figure 7. Total Europe and European Union oil production, including natural gas liquids, based on data from the 2023 Statistical Review of World Energy, published by the Energy Institute.
Under these circumstances, members of the EU found that they needed to import nearly all of their oil, and that most of this oil needed to come from outside Europe.
When I look at the data regarding the types of oil the EU has chosen to consume (nearly all imported), I find that it uses an oil mix that is unusually skewed toward Middle Distillates and away from Light Distillates. (Compare Figure 8 with Figure 3).
Figure 8. EU oil consumed by product type based on “Regional Consumption” data from the 2023 Statistical Review of World Energy, produced by the Energy Institute. Oil includes natural gas liquids.
Part of the reason the EU uses this skewed oil mix is because it has encouraged the use of private passenger cars using diesel through its tax structure. Underlying this tax structure was most likely an understanding that Russia, through its exports of Urals Oil, which is heavy, could provide the EU with the mix of oil products it needed, including extra diesel.
The EU has recently cut off most oil imports from Russia as a way of punishing Russia. This cutoff is being phased in, with most of the impact in 2023 and later. Thus, Figure 8 (which is through 2022) shouldn’t be much affected.
China and India are now buying most of Russia’s exported oil. These countries tend to use the oil more “efficiently” than the EU. In particular, they do more manufacturing than the EU, and they have far fewer private passenger cars per capita than the EU. Furthermore, the EU powers quite a few of its private passenger cars with diesel. If diesel is in short supply, efficiency demands that it should be saved for uses that require it, such as powering heavy equipment.
Because of the efficiency issue, I doubt that the EU will be able to continue importing as high a diesel mix in the future as it has been importing up to now. We know that Saudi Arabia cut back its oil exports by 1 million barrels per day, as of July 1, and this cutback is continuing into August. Russia is also cutting its production by 500,000 barrels a day, effective August 1. If oil prices rise again, I wonder whether the EU will be forced to cut back on its oil imports, essentially because of the Maximum Power Principle.
[9] The substitution of electricity for oil so far has been mostly in the direction of replacing gasoline usage for private passenger automobiles. Substitution of electricity for Middle Distillates would be virtually impossible.
Middle Distillates are largely used for the tough jobs–jobs that require big bursts of power. Electricity and the battery storage required for electricity are not adapted to these tough jobs. The vehicles become too heavy, especially when the big battery packs that would be required are considered. The Wall Street Journal recently reported that battery-powered commercial trucks can cost more than three times the price of diesel-powered trucks, a hurdle much smaller private passenger automobiles don’t face. The wide diversity of types of heavy commercial vehicles would be another huge hurdle in trying to substitute electricity for diesel.
Oil is a mixture of different hydrocarbon lengths. Substitution of electricity for one part of the hydrocarbon mix, namely for the Light Distillates, is not very helpful. Oil companies need to be able to sell all parts of the mix in order to make their extraction efforts worthwhile. If oil companies find themselves without buyers for most Light Distillates, they would have difficulty recouping their overall costs. There would be a possibility of oil production stopping. Without oil, farming would mostly stop. Road repair would stop. Today’s economy would come to a halt.
Of course, as a practical matter, the vast majority of the world will pay no attention to mandates that all private passenger automobilesbe EVs. Buyers in most parts of the world will make decisions based on which cars are least expensive to own and operate. As a result, there is little chance of private passenger cars being completely replaced by EVs. Instead, EV mandates in some countries may somewhat reduce the selling price of gasoline worldwide because these drivers are no longer using gasoline. With lower gasoline prices, non-EV’s are likely to become cheaper to operate in countries where they are permitted, boosting their sales. This is an effect similar to Jevons Paradox.
[10] There are many related topics that could be addressed, but they will need to wait until later posts.
A few of samples of other issues:
[a] The world economy is tightly networked together. Inadequate oil supplies per capita tend to push the economy toward forced reduced activity, as was the case in 2020. Oil prices likely won’t rise a whole lot higher, for very long, if the economy is forced to shrink.
[b] Inadequate oil supplies per capita also tend to cause fighting among countries. OECD countries seem to over consume, relative to the benefits they provide to the rest of the world. Perhaps some grouping of non-OECD countries (or parts of countries) will take over in leadership roles.
[c] The self-organizing economy has different priorities than human leaders. All ecosystems in a finite world go through cycles. As conditions change, different species are favored, and new species emerge. Humans have a strong preference for recent conditions that helped humans thrive. Humans need a religion to follow, so leaders have created environmentalsin to replace original sin. The catch is that ecosystems are built for change. Pollution can be viewed as a type of fertilizer for different types of species or recent mutations to thrive. Higher temperatures will have a net favorable effect for some organisms.
[d] If a local economy chooses to increase energy costs by taking steps to reduce its carbon footprint, the main impact may be to disadvantage the local economy relative to the world economy. If total energy costs are higher, the cost of finished goods and services is likely to be higher, making the economy less competitive.
[e] I expect that the members of the EU and other rich nations will be the primary countries pursuing carbon reduction technologies. Poorer economies may pay lip service to carbon reduction, but they will tend to focus primarily on increasing the welfare of their own people, whether or not this requires more carbon.
For example, in 2022, China accounted for 66% of global EV sales (5.0 million out of 7.7 million), thanks to subsidies that China made available. China no doubt had many motives, but one of them would seem to be to stimulate the economy. Another motive would be to increase the total number of vehicles in operation. The majority (61%) of electricity generation in China in 2022 was provided by electricity coming from coal-fired power plants, based on information from the Energy Institute. I would expect that more Chinese vehicles manufactured and placed into operation plus more use of electricity from coal would lead to a greater quantity of carbon emissions, rather than a smaller quantity.


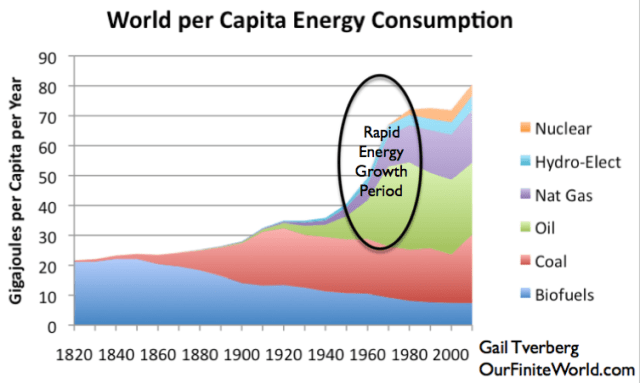


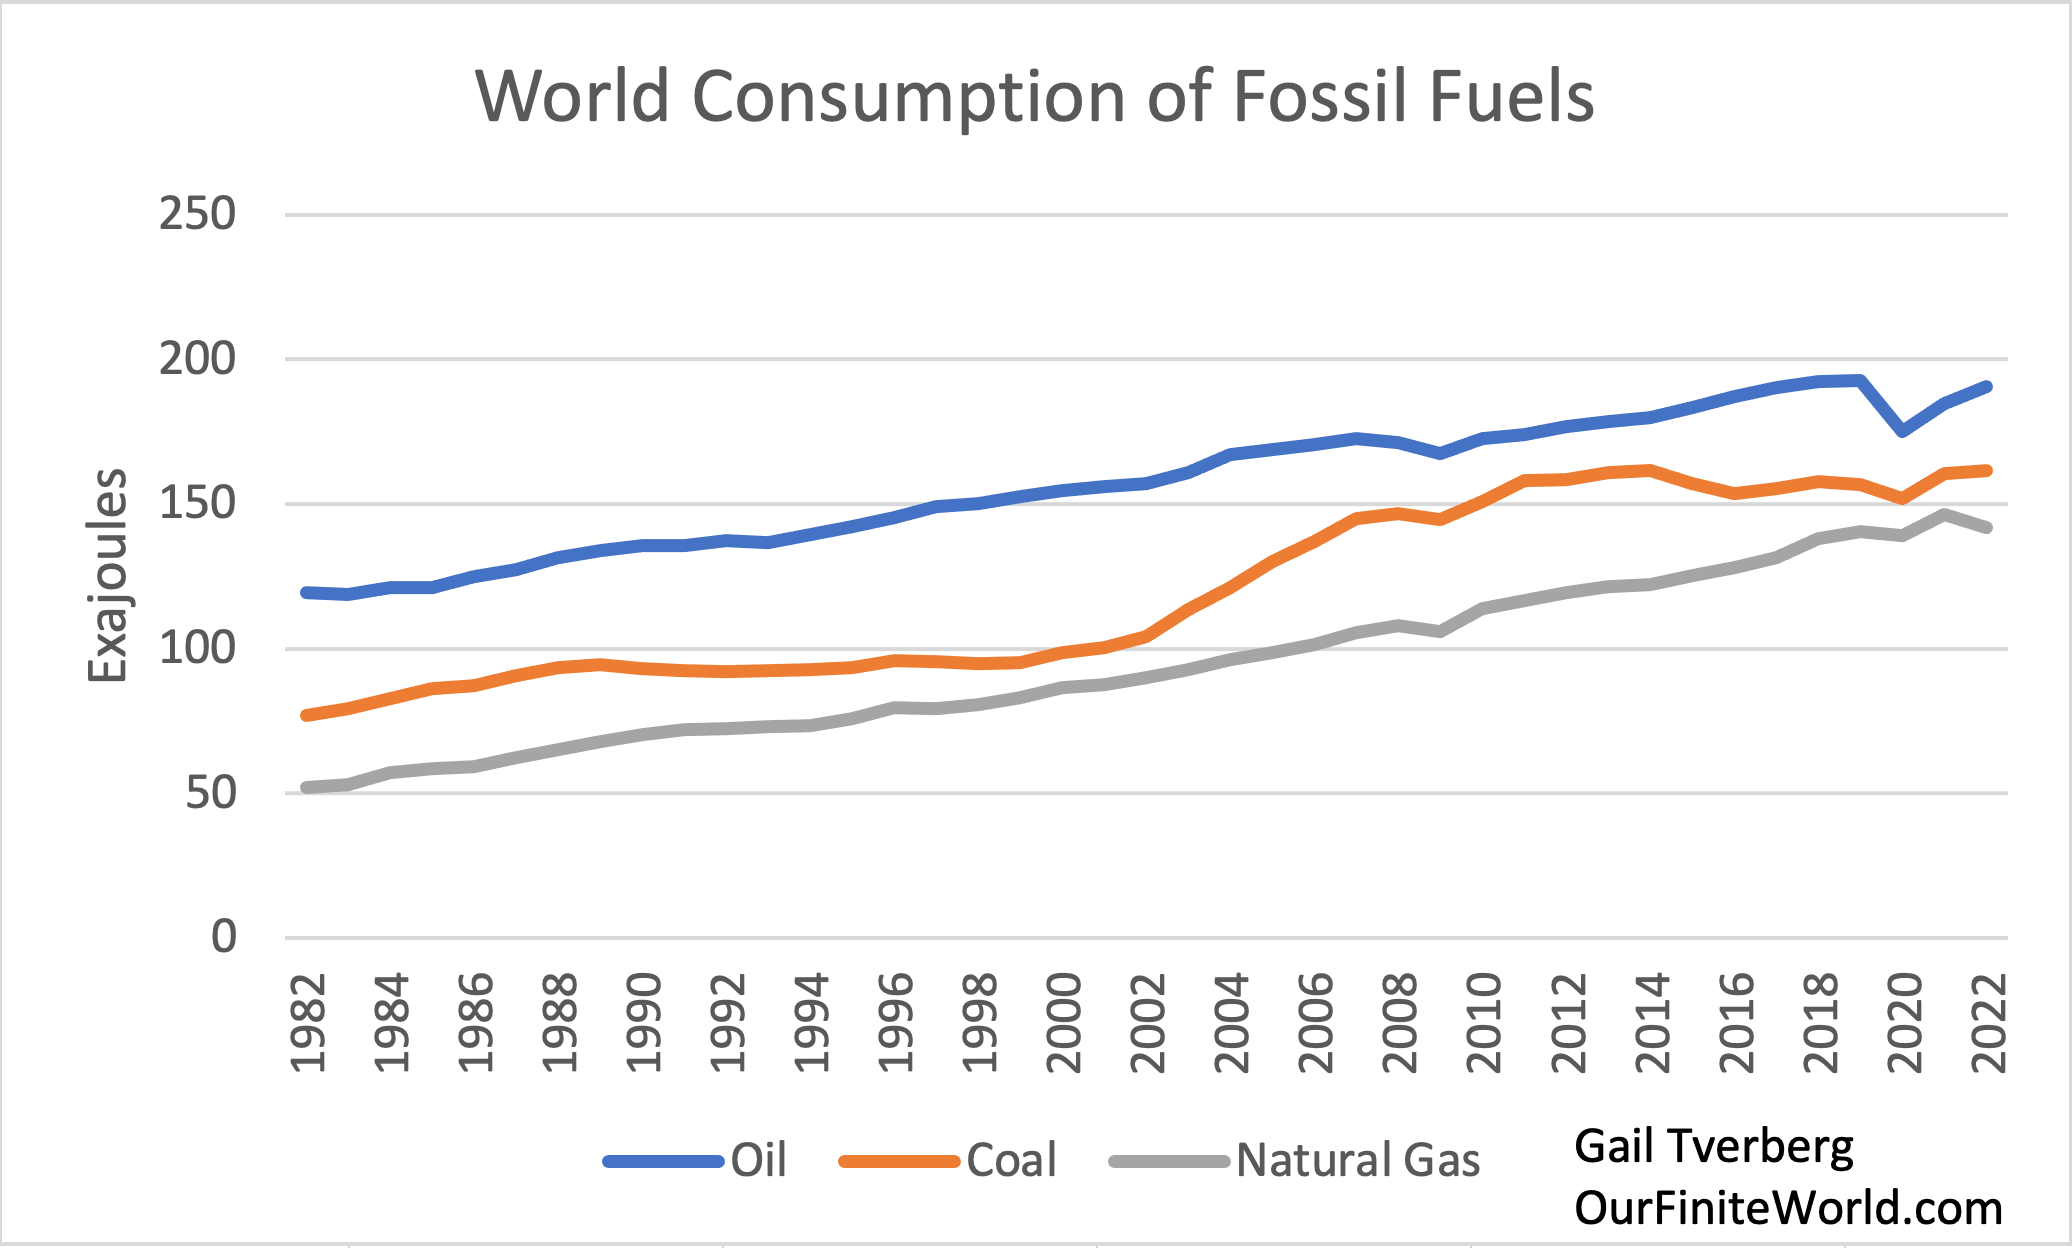
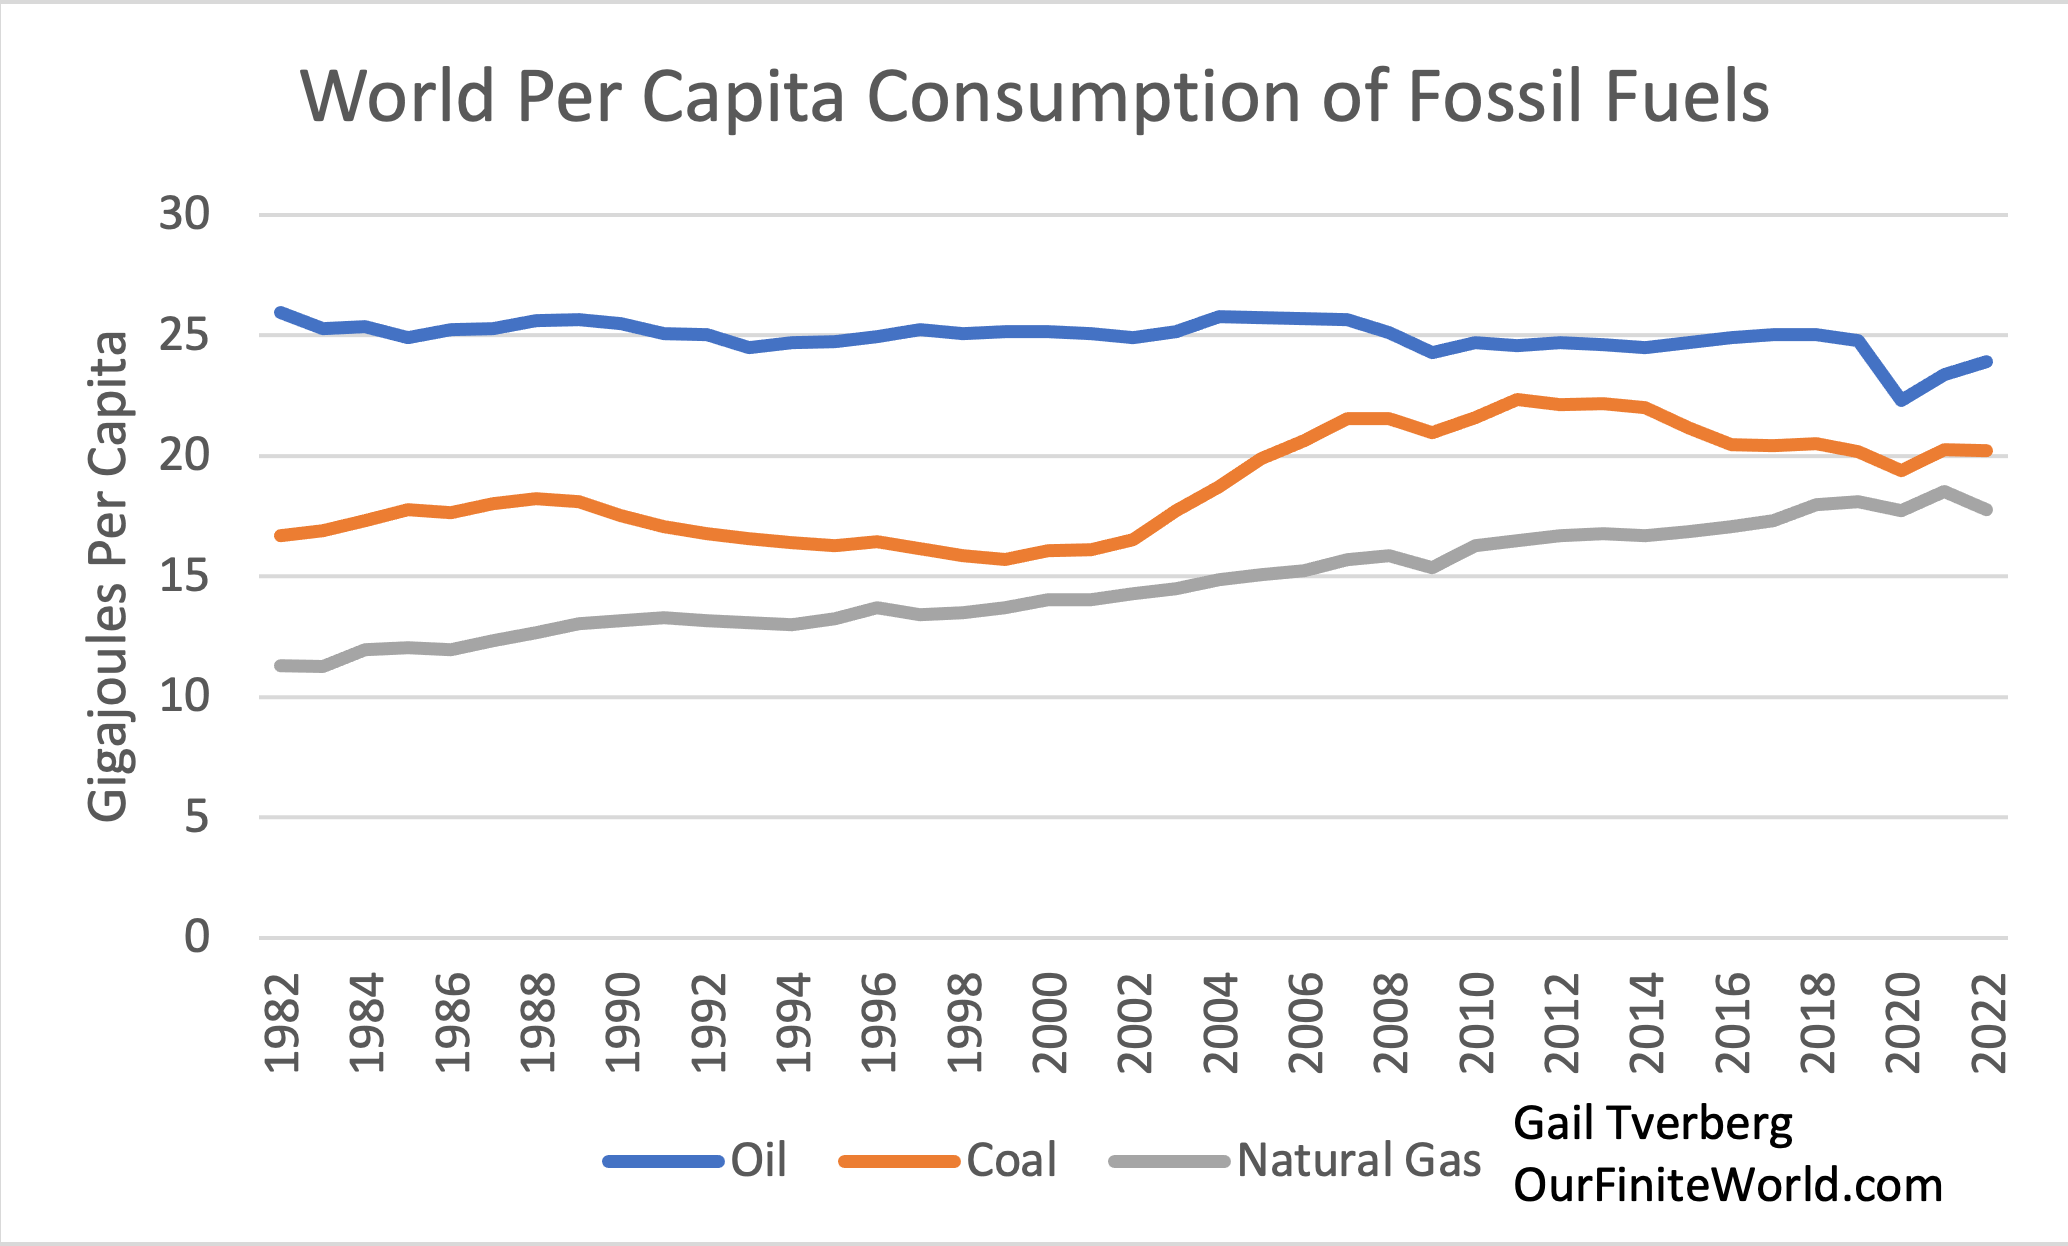
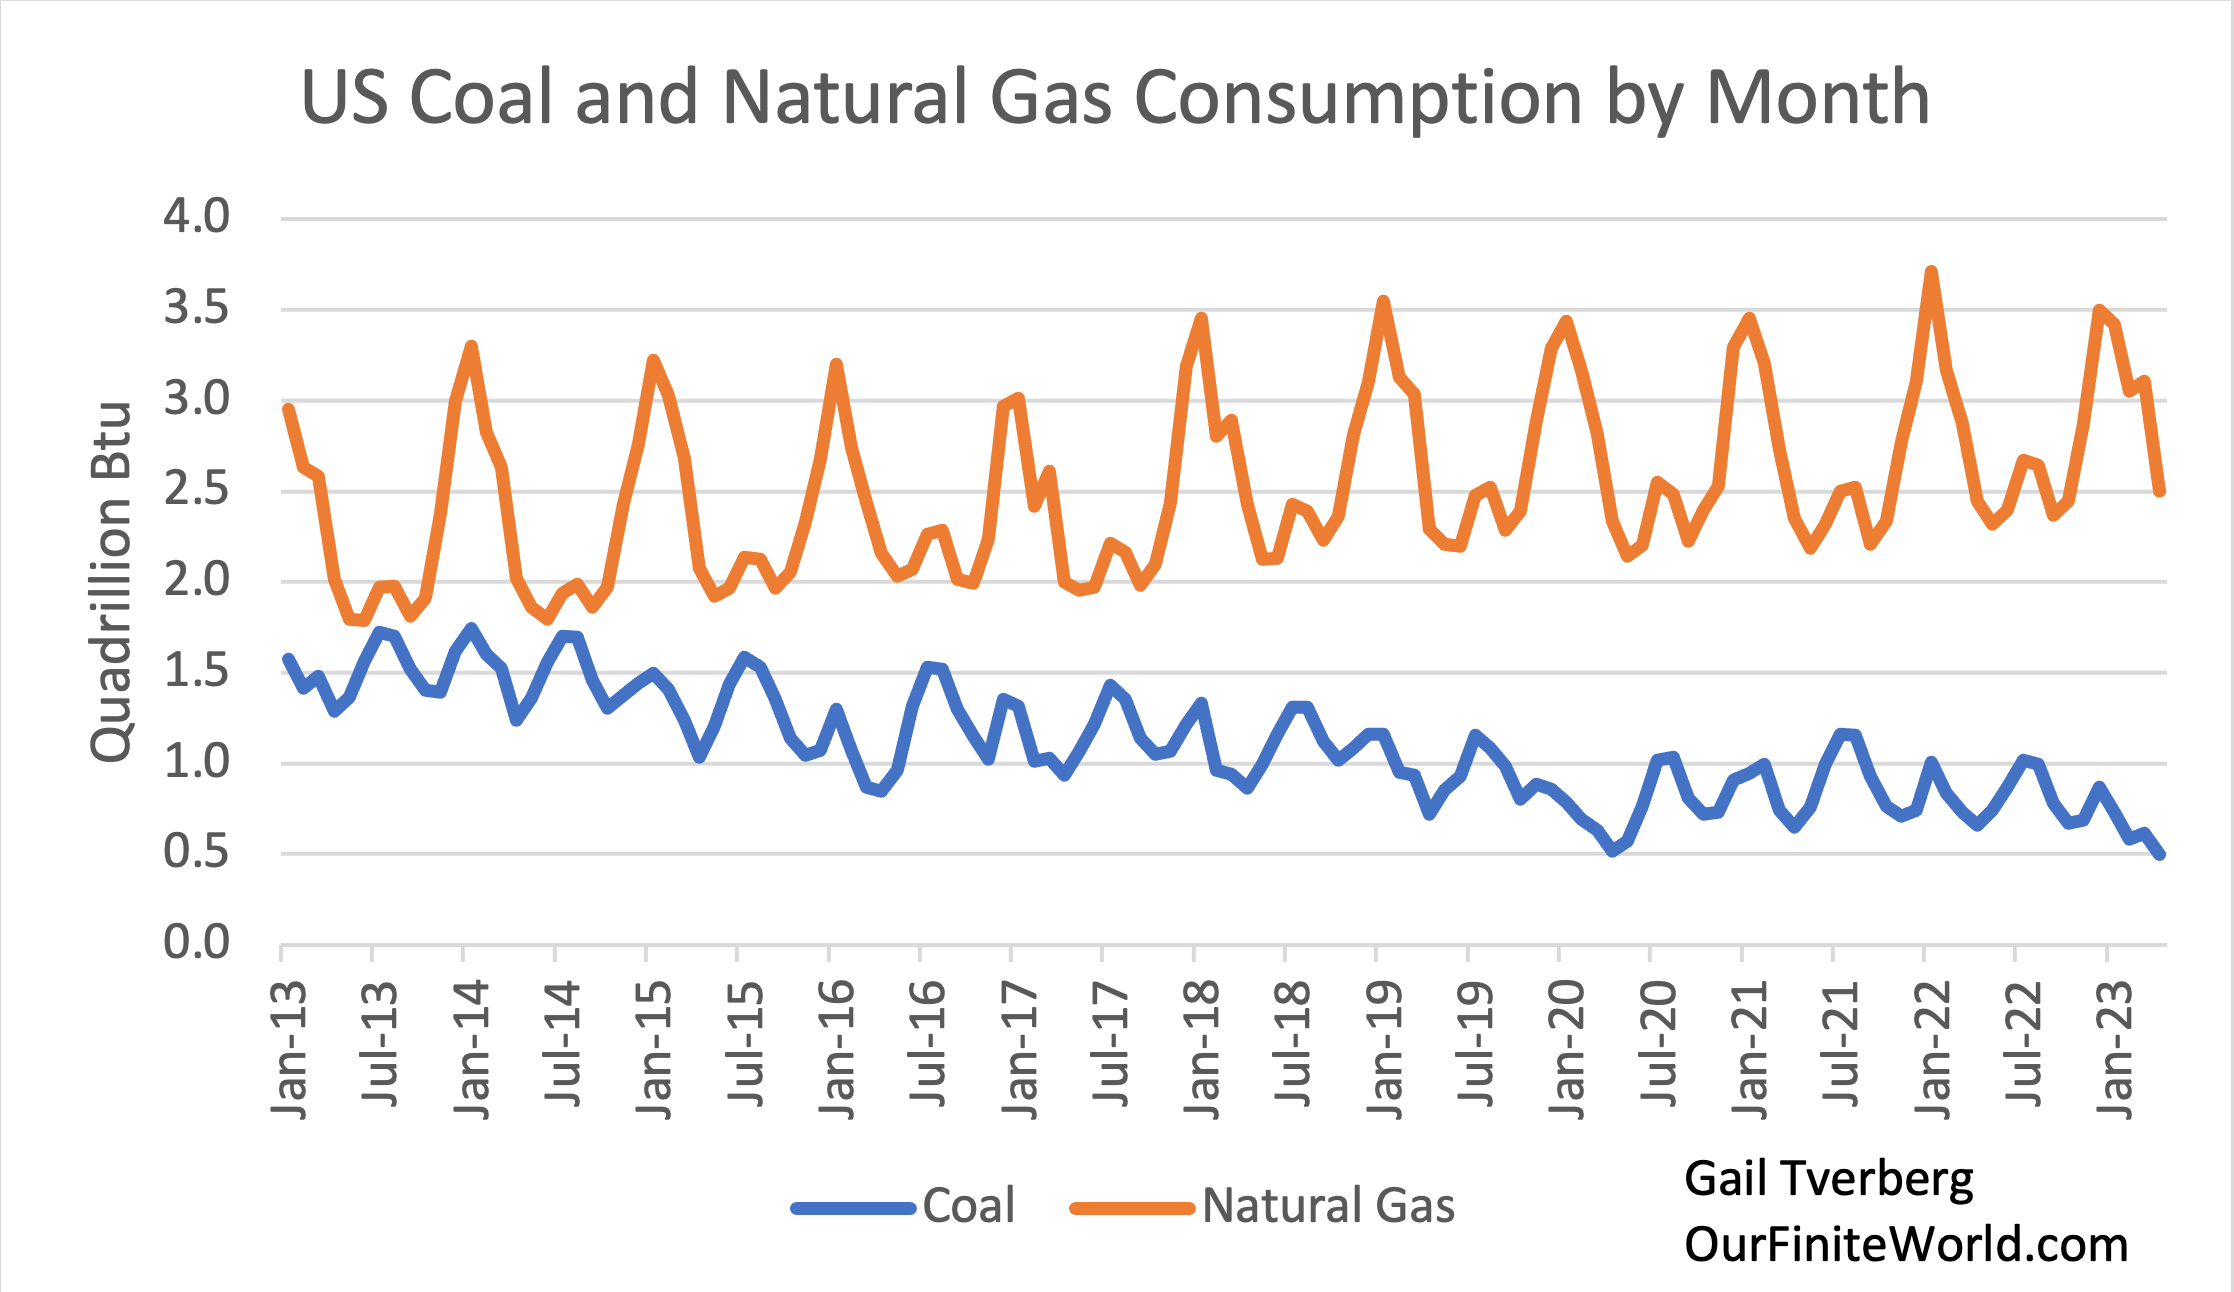
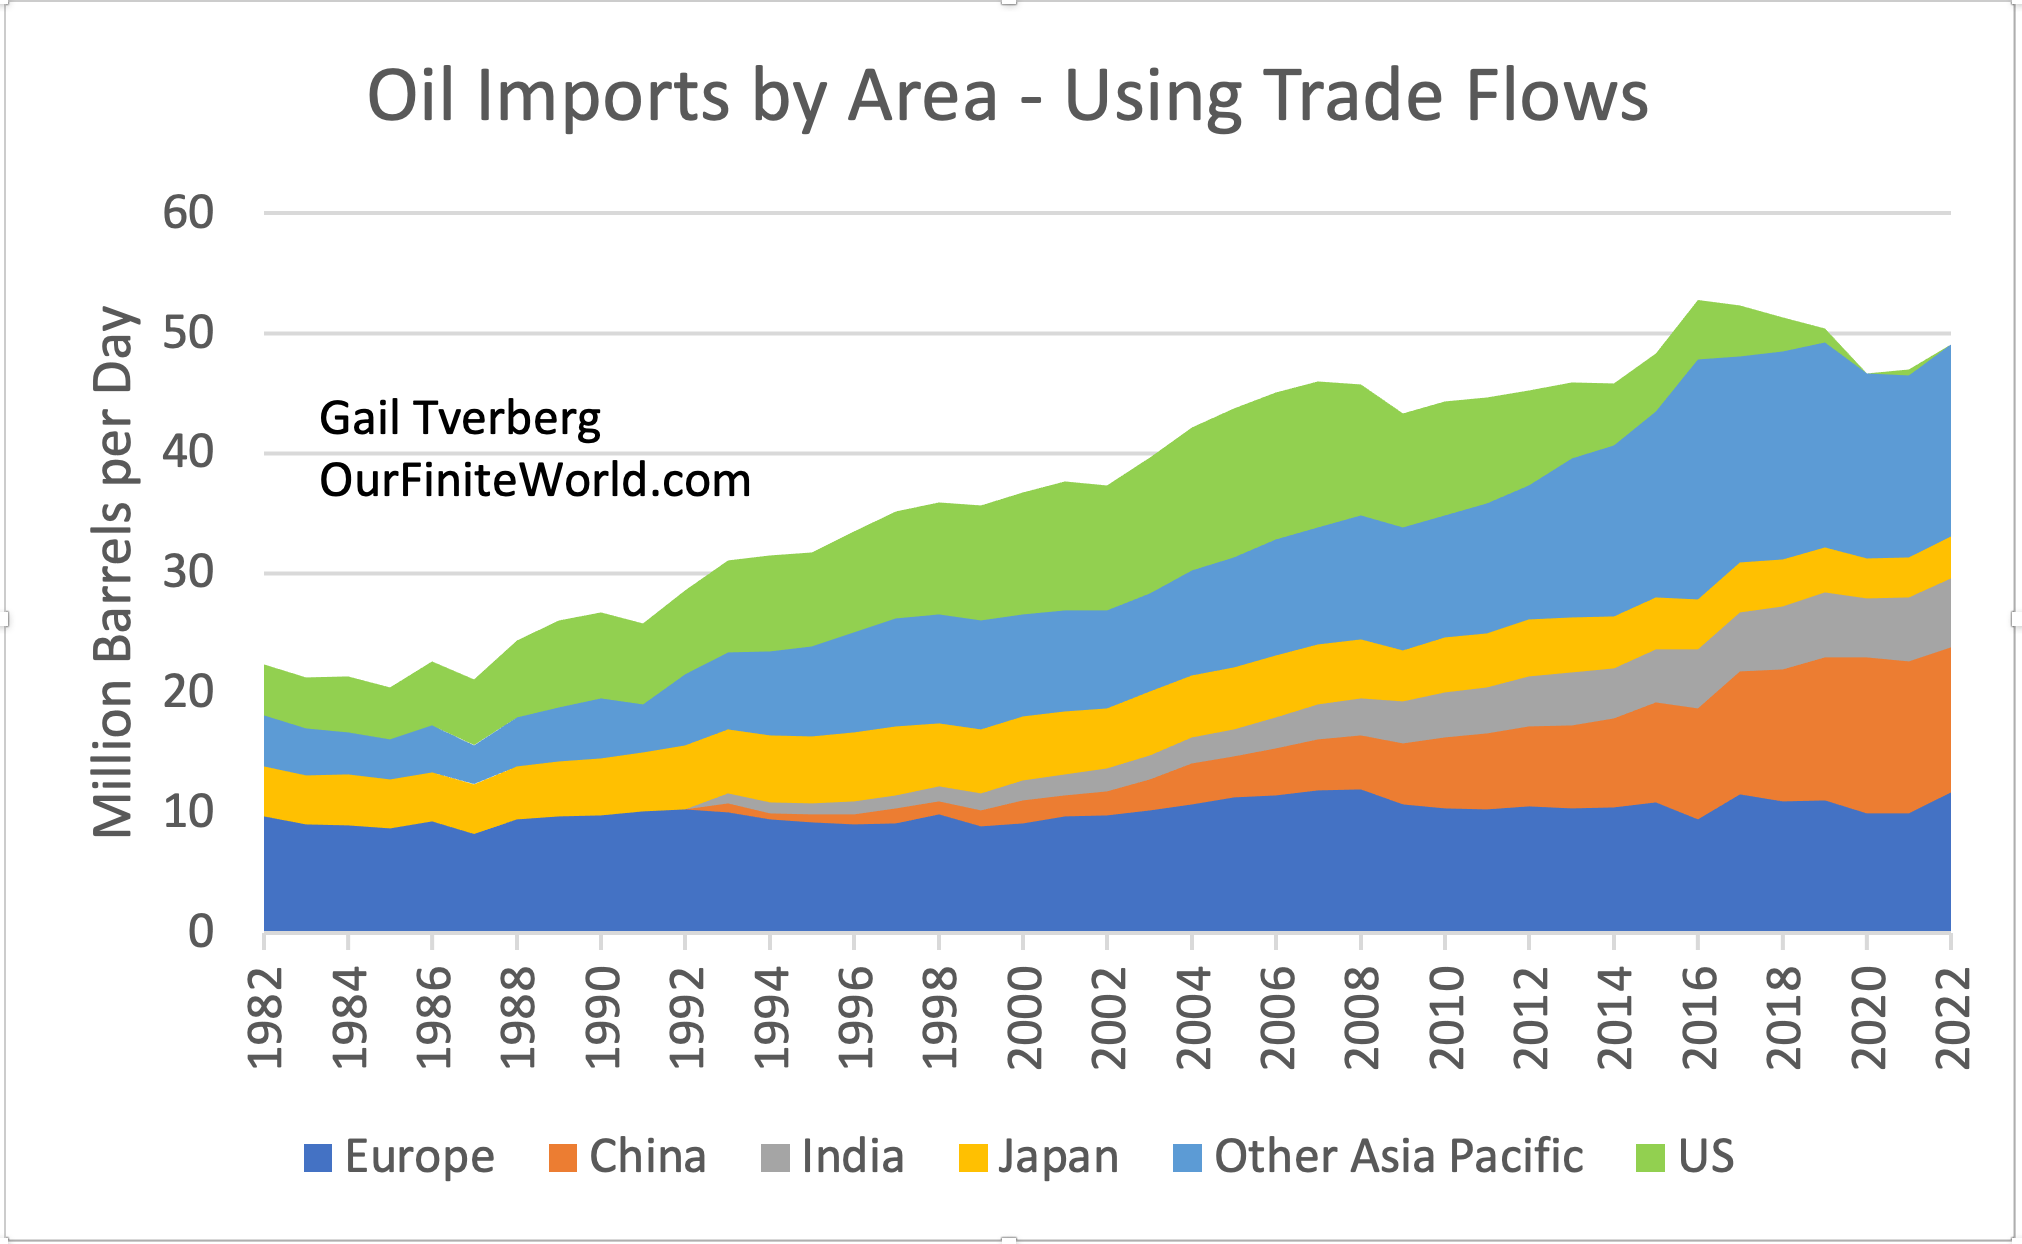
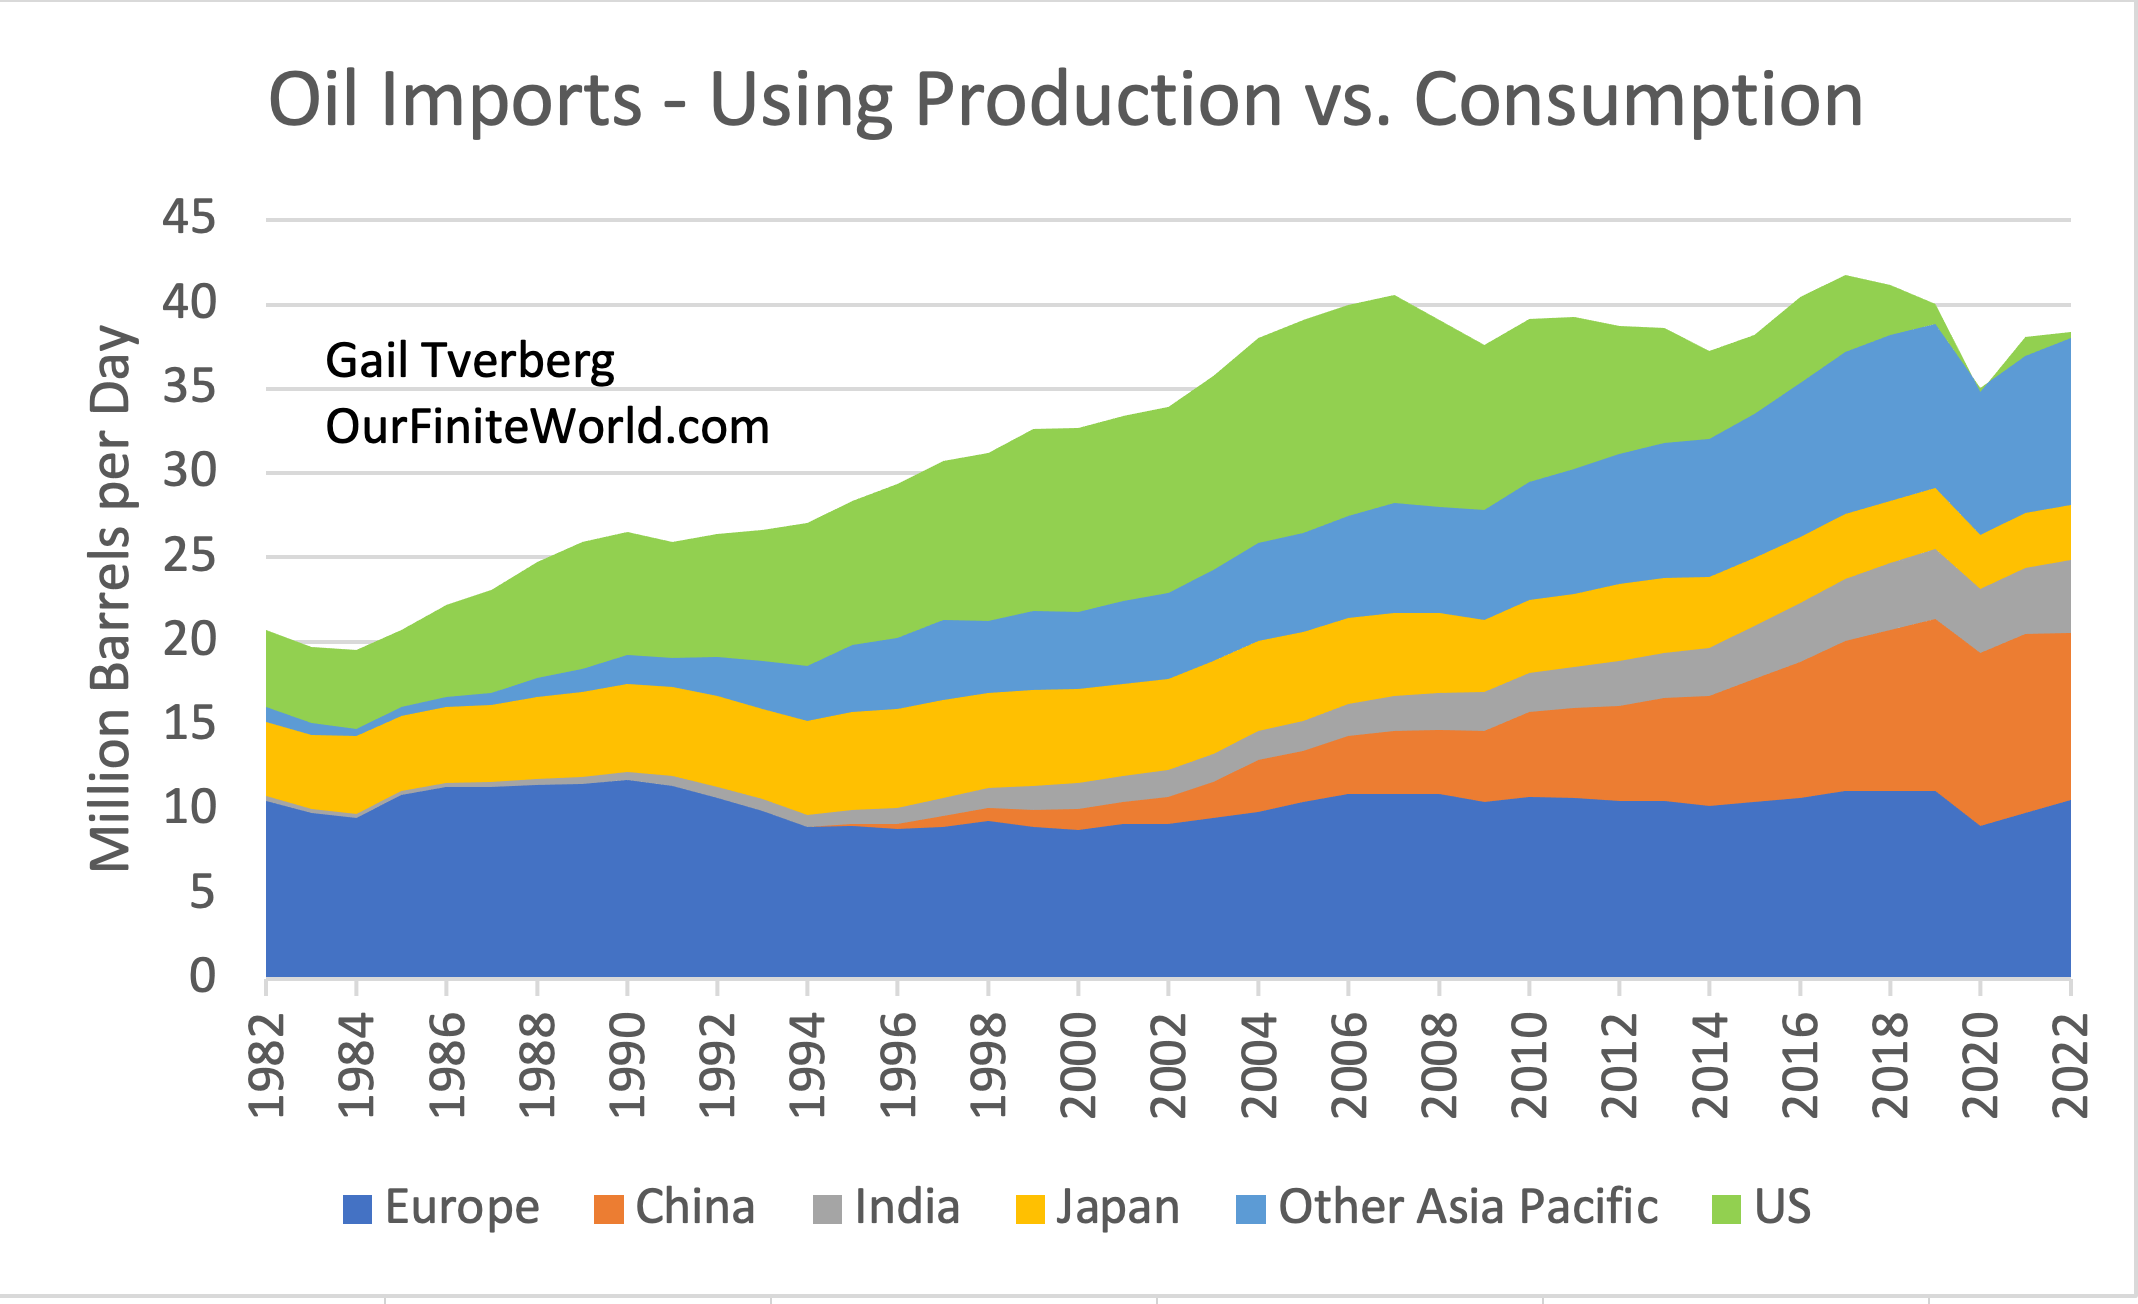
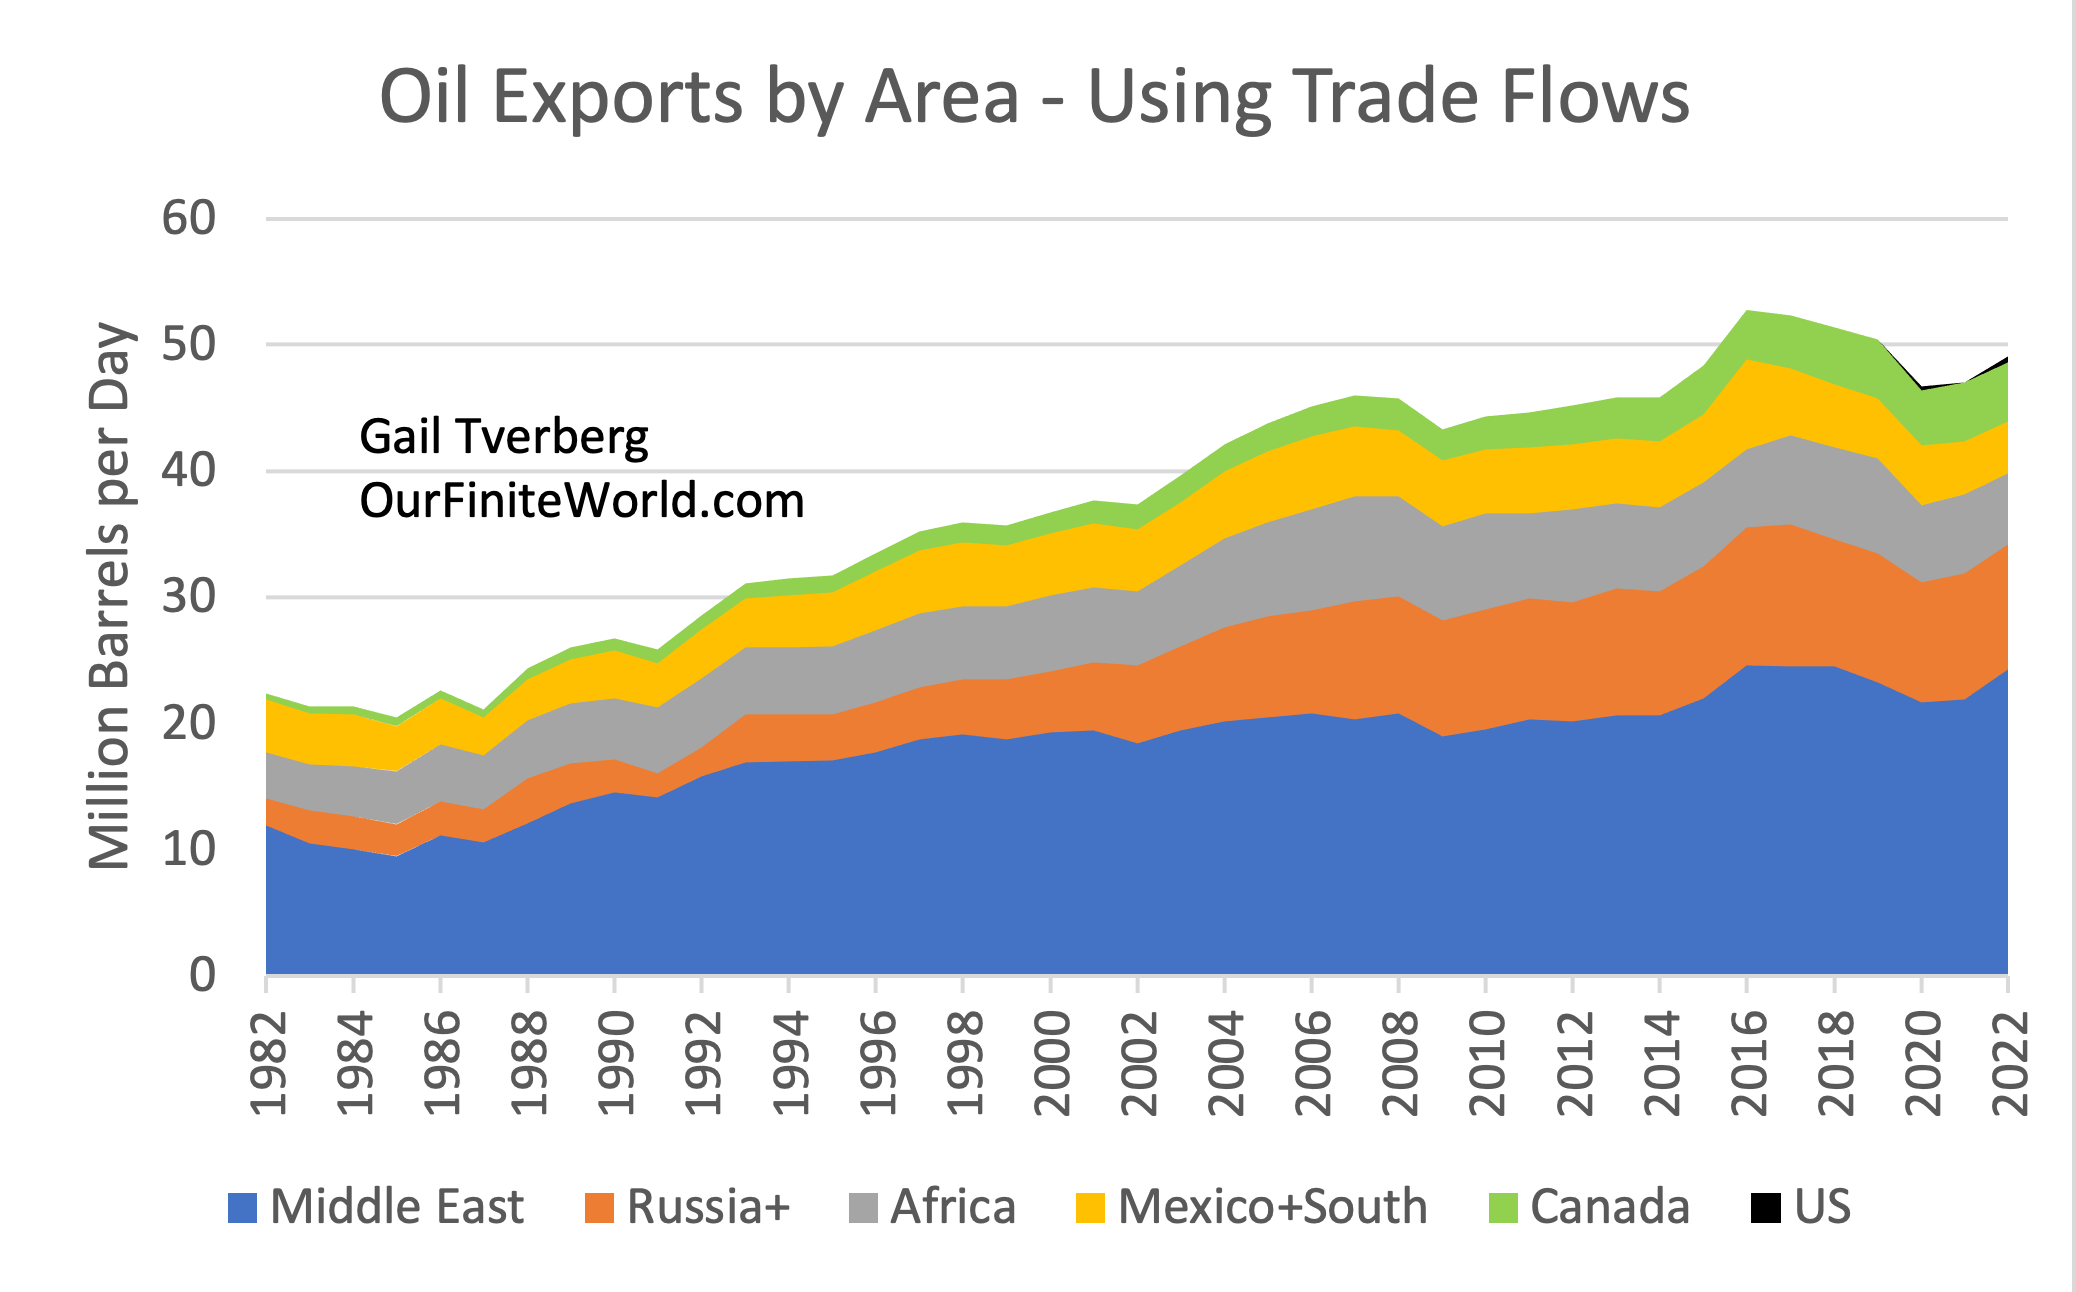
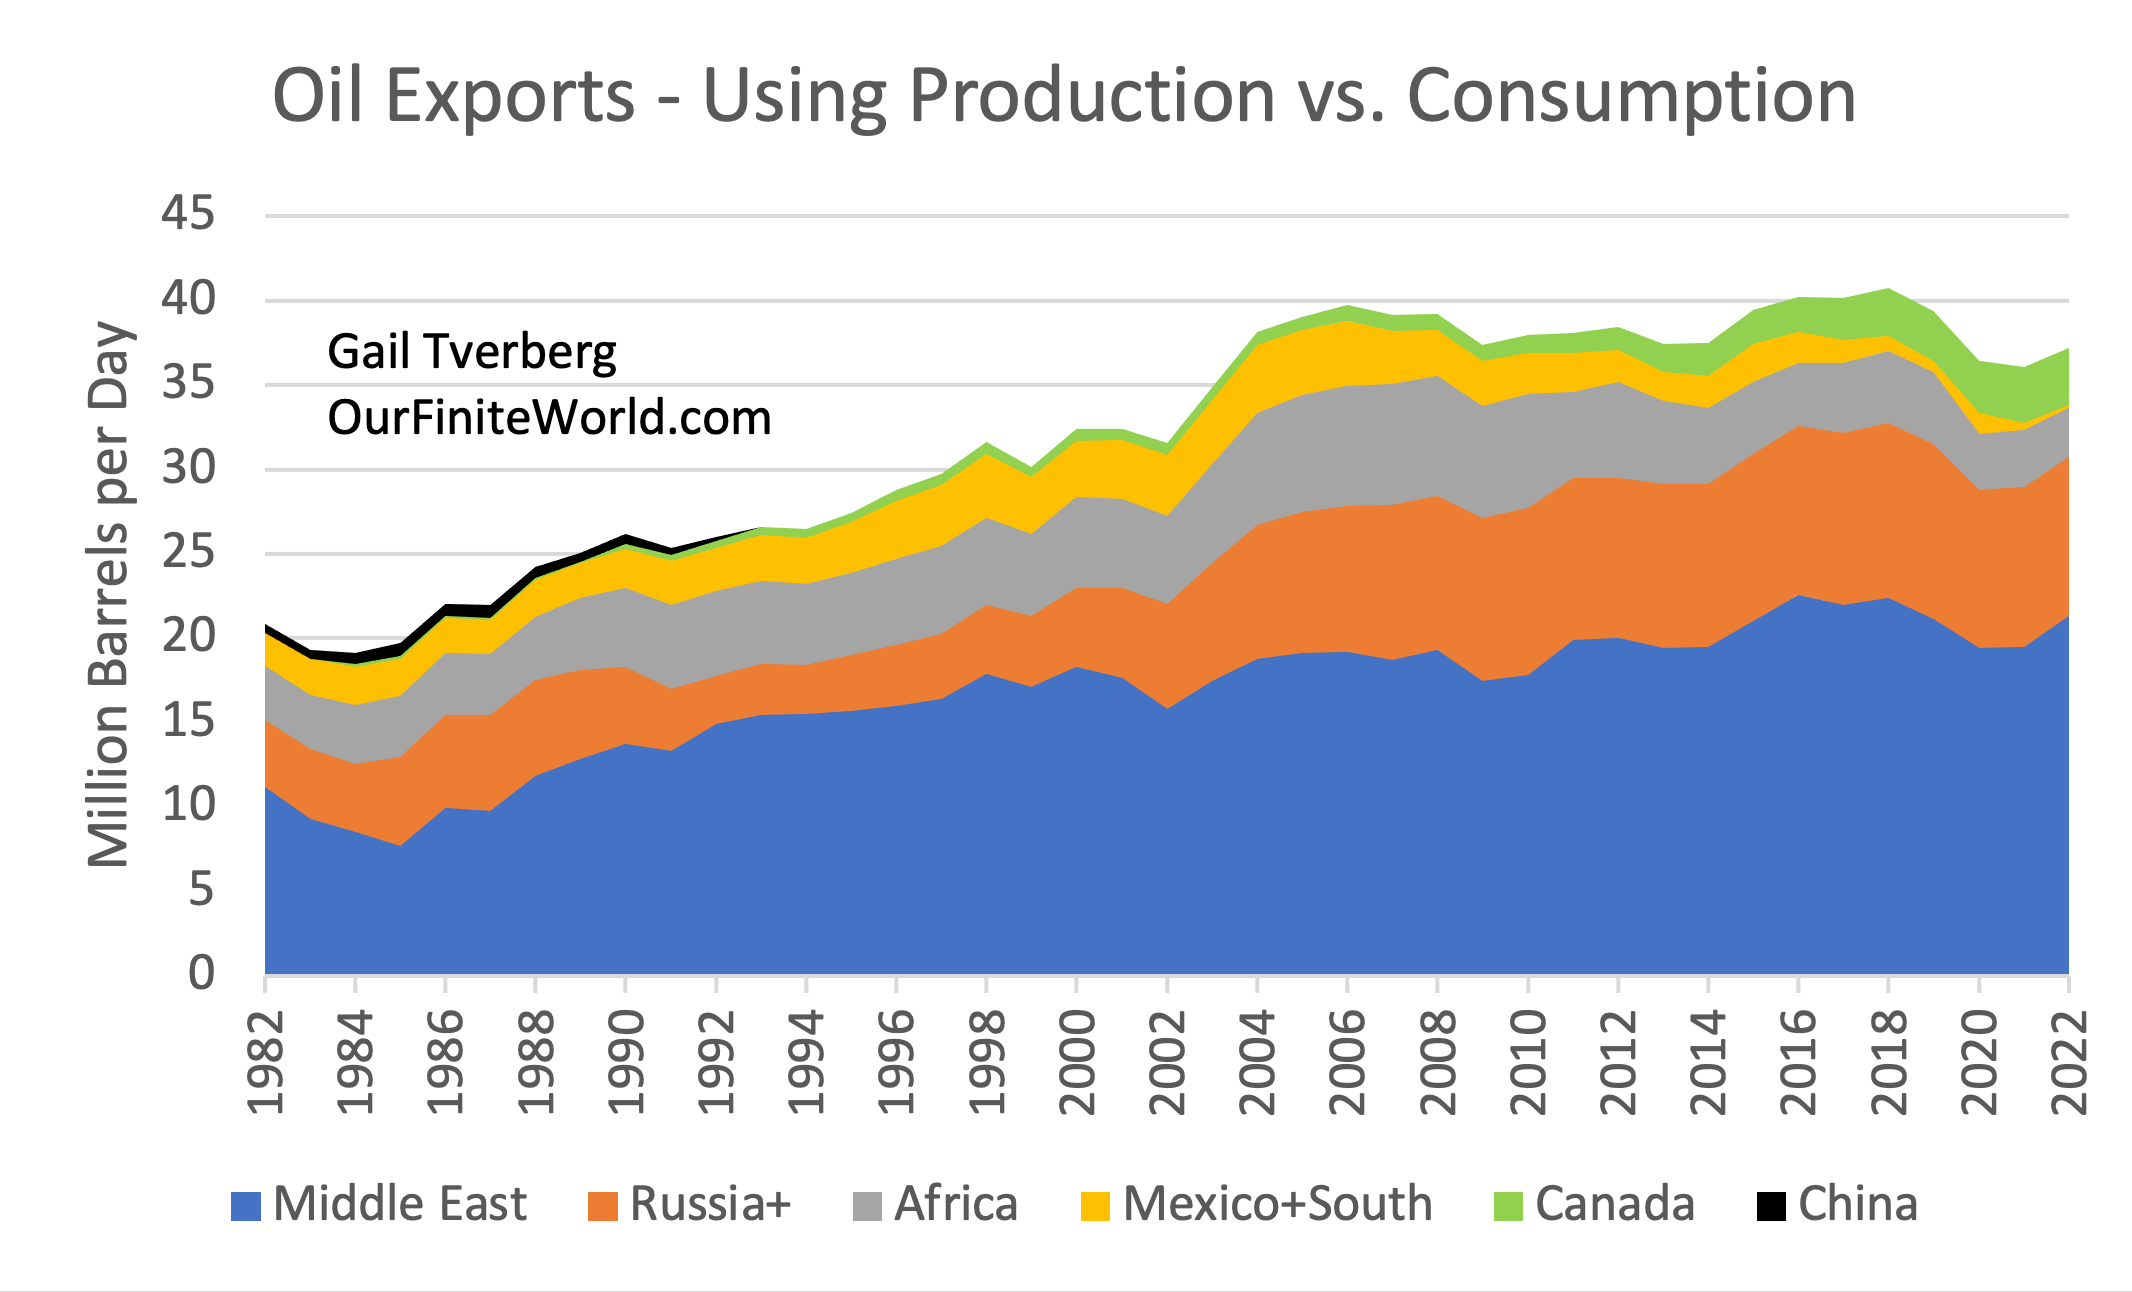


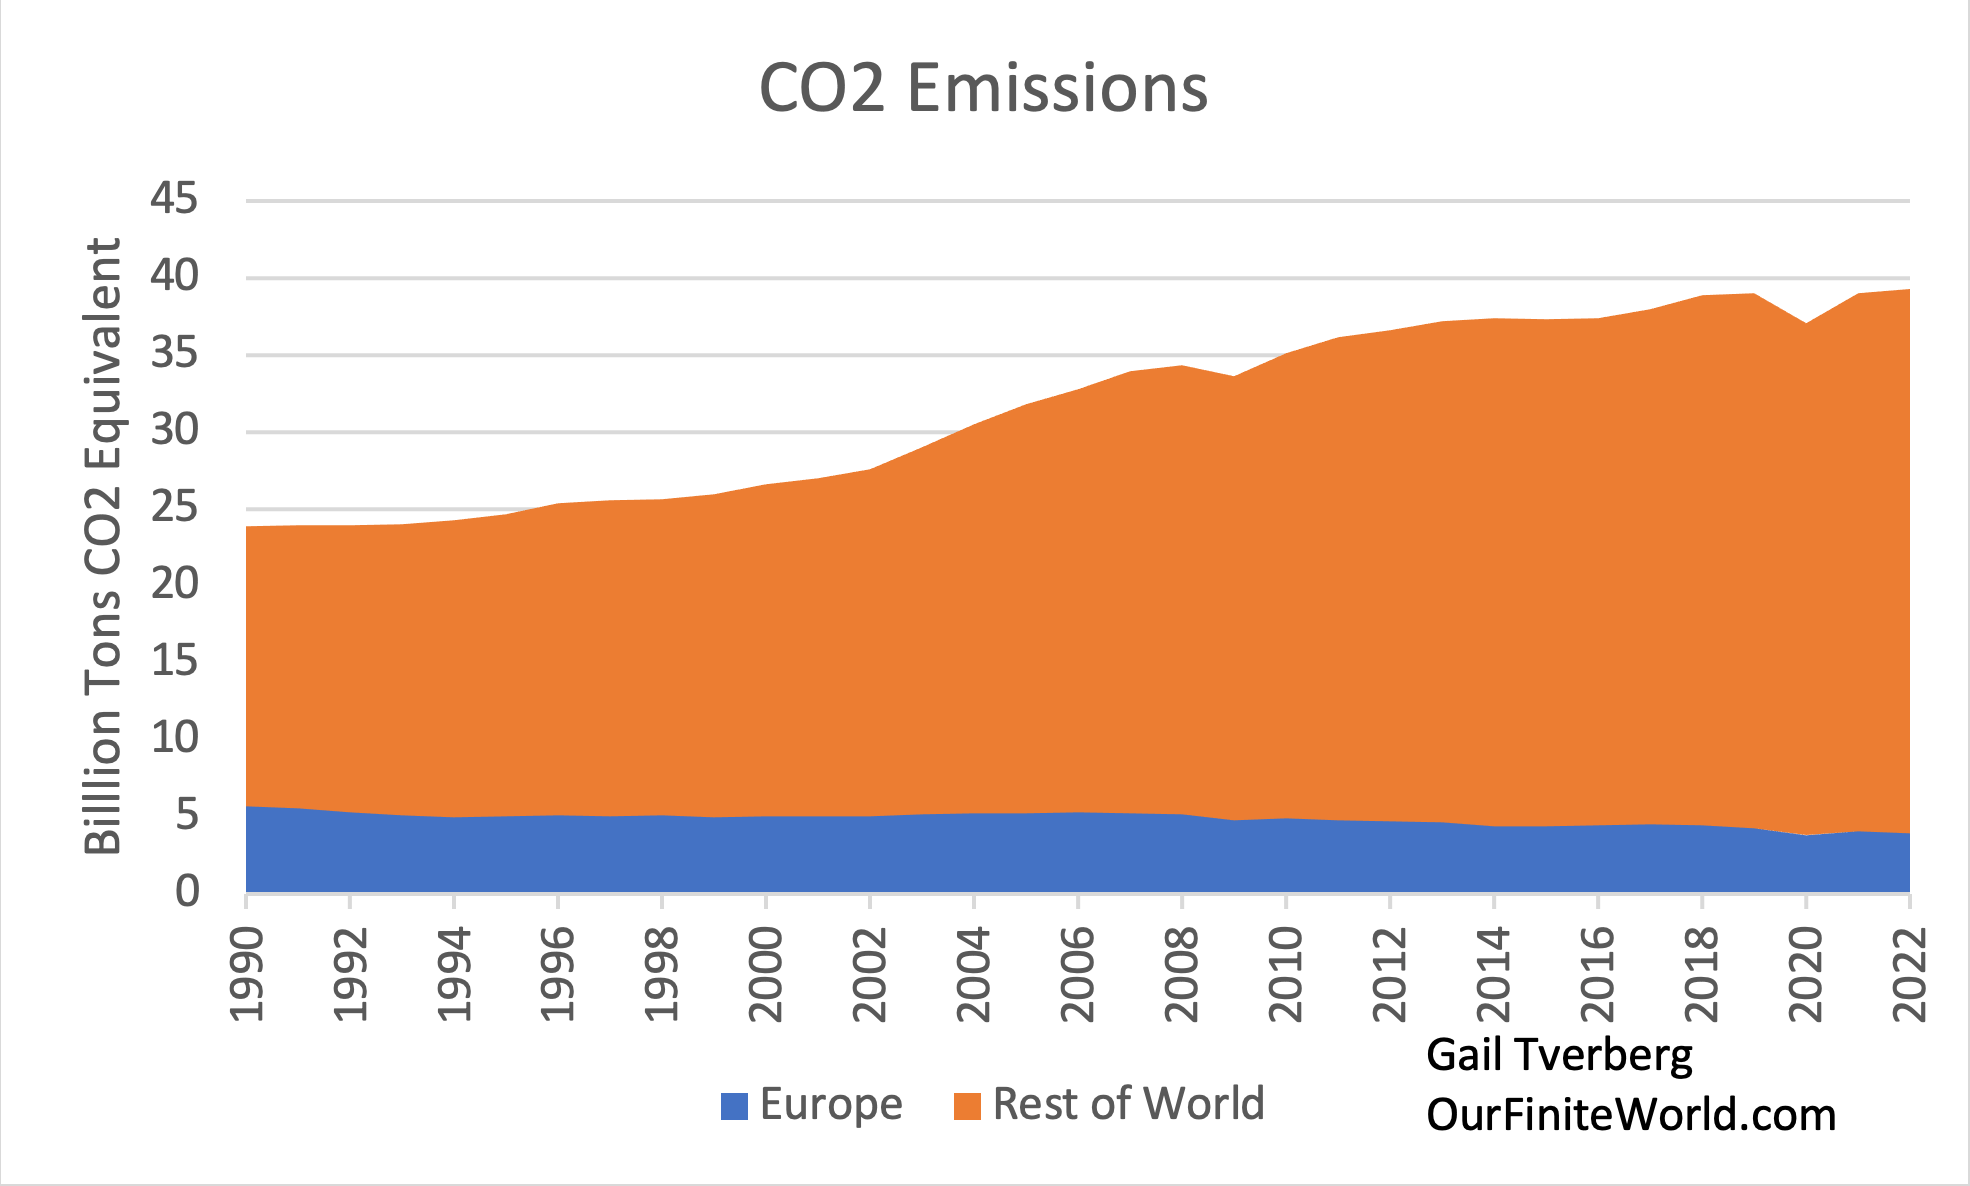


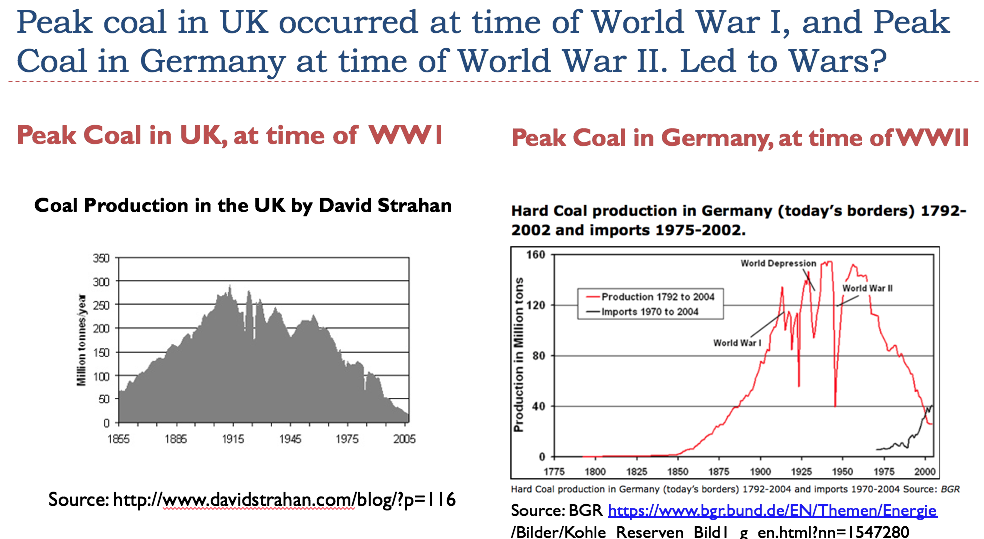