

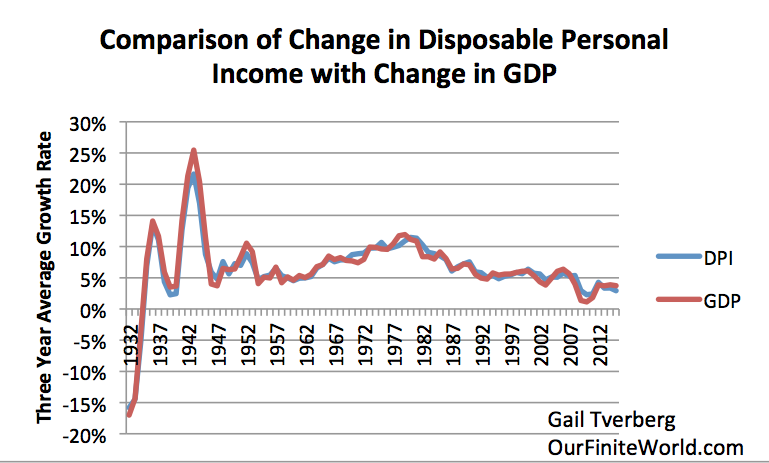
Figure 16. Comparison of 3-year average change in disposable personal income with 3-year change average in GDP, based on US BEA Tables 1.1.5 and 2.1.
What has gone wrong with oil prices, debt, and GDP growth?
Figure 16. Comparison of 3-year average change in disposable personal income with 3-year change average in GDP, based on US BEA Tables 1.1.5 and 2.1.
| raviuppal4 on Losing the Iran War May Be the… | |
| raviuppal4 on Losing the Iran War May Be the… | |
| Tim Groves on Losing the Iran War May Be the… | |
| Tim Groves on Losing the Iran War May Be the… | |
| adonis on Losing the Iran War May Be the… | |
| Tim Groves on Losing the Iran War May Be the… | |
| Tim Groves on Losing the Iran War May Be the… | |
| Tim Groves on Losing the Iran War May Be the… | |
| Gail Tverberg on Losing the Iran War May Be the… | |
| Gail Tverberg on Losing the Iran War May Be the… | |
| Gail Tverberg on Losing the Iran War May Be the… | |
| user on Losing the Iran War May Be the… | |
| Rodster on Losing the Iran War May Be the… | |
| I AM THE MOB on Losing the Iran War May Be the… | |
| Gail Tverberg on Losing the Iran War May Be the… |