

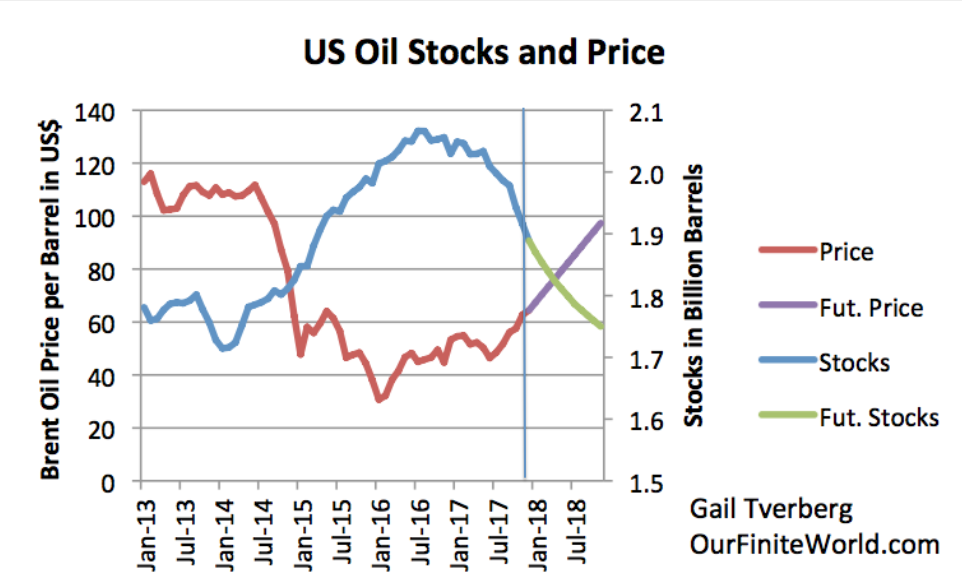
Figure 8. Figure showing US oil stocks (crude plus oil products) together with the corresponding oil prices. Rough guess of how balance might disappear and future prices by author.
Will the World Economy Continue to “Roll Along” in 2018?
Figure 8. Figure showing US oil stocks (crude plus oil products) together with the corresponding oil prices. Rough guess of how balance might disappear and future prices by author.