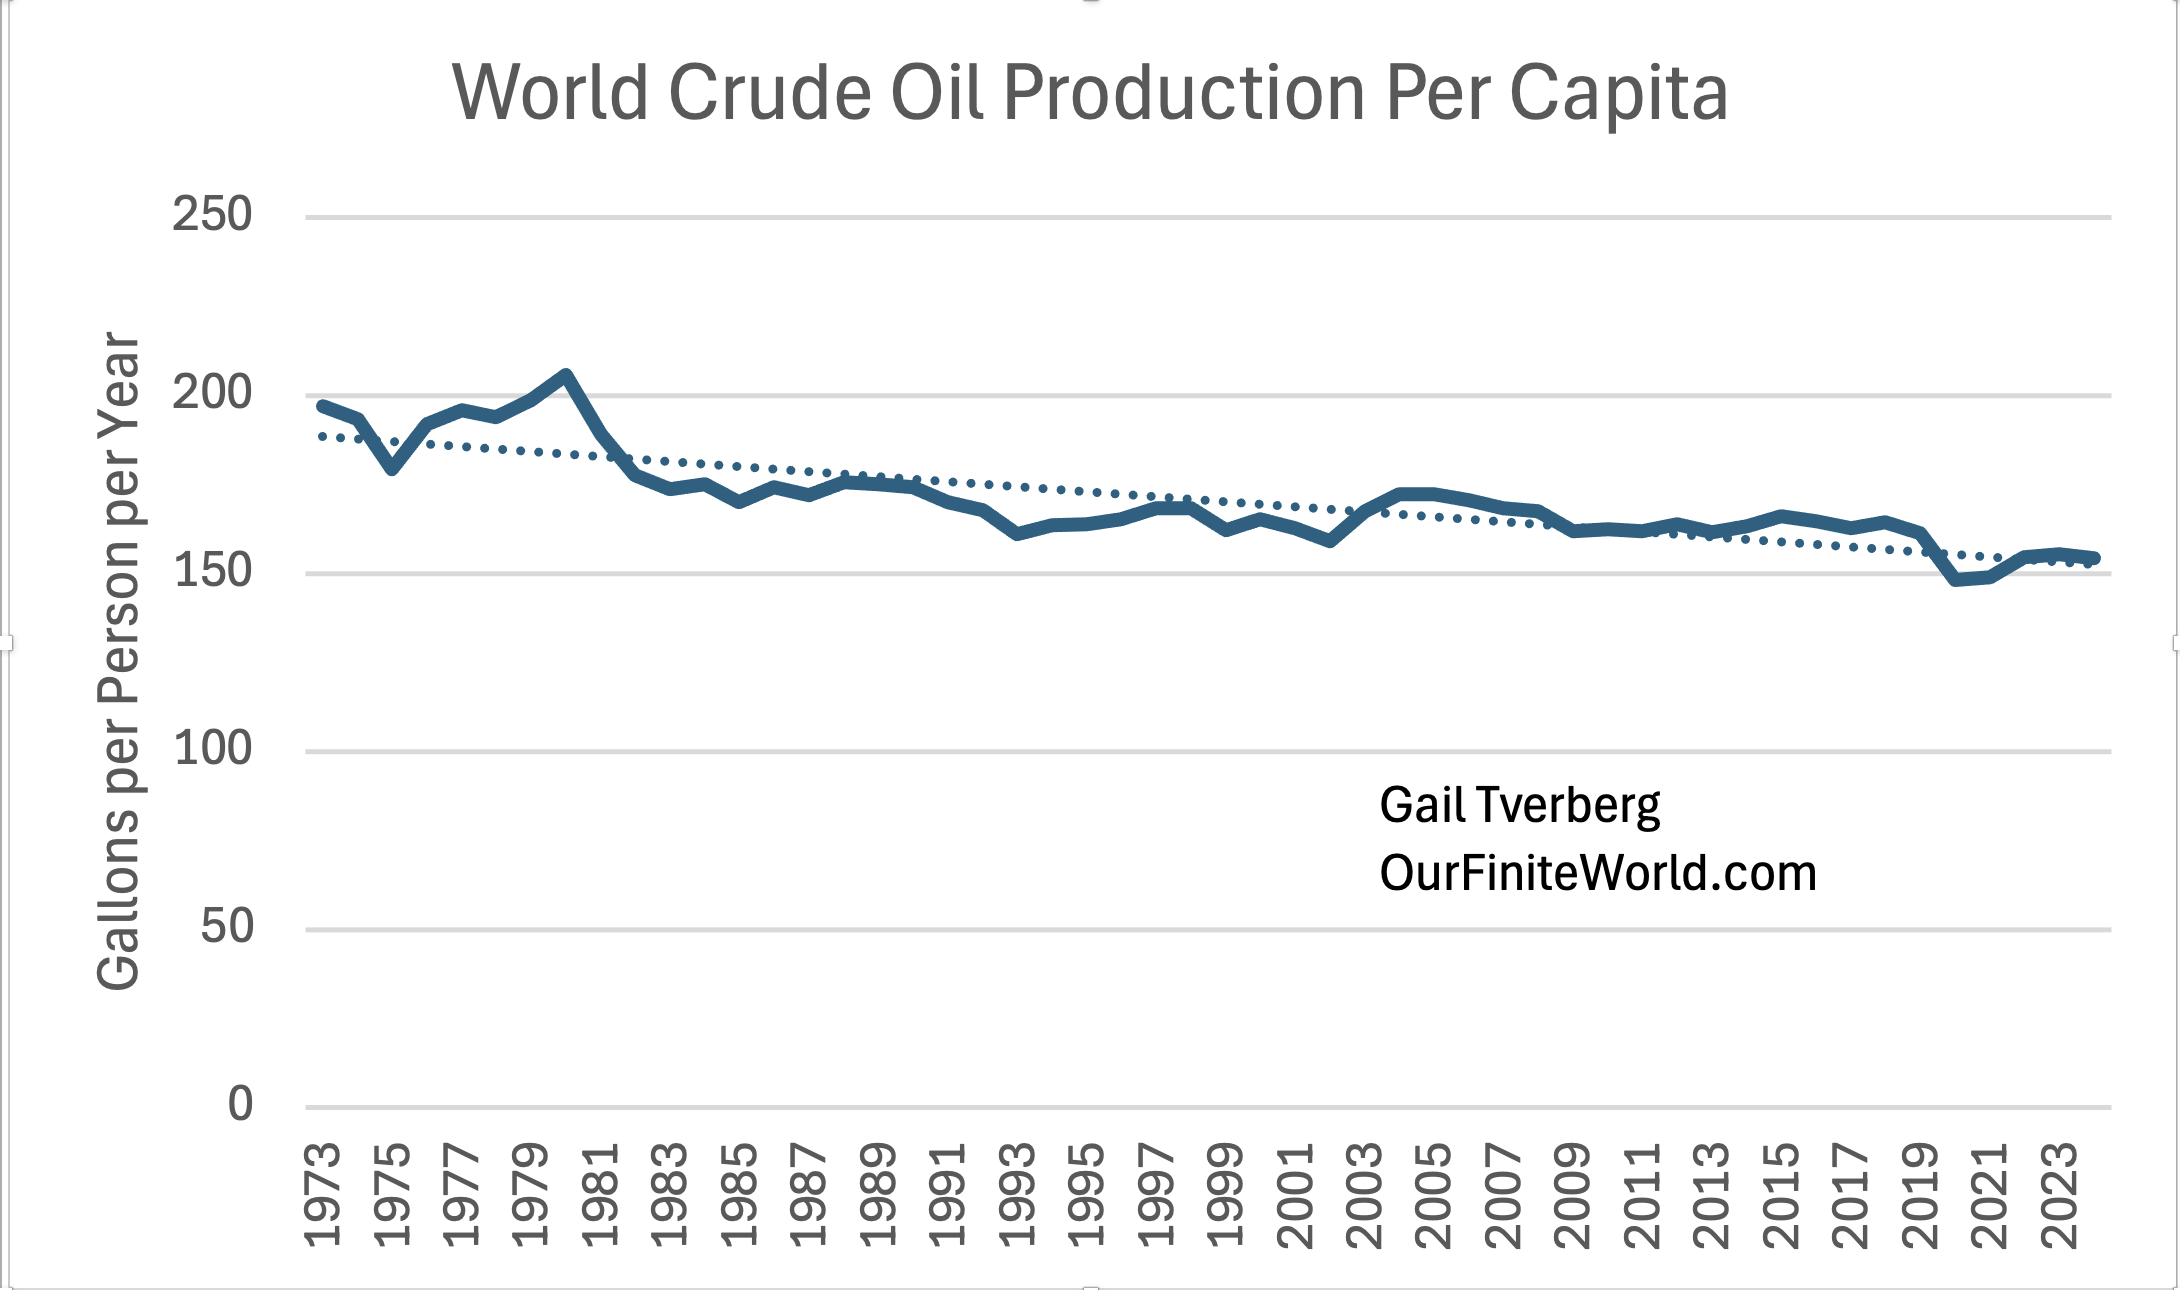
Figure 1. World crude oil production per capita since 1973, with fitted trend line, based on EIA data.

