
Does it make a difference if our models of energy and the economy are overly simple? I would argue that it depends on what we plan to use the models for. If all we want to do is determine approximately how many years in the future energy supplies will turn down, then a simple model is perfectly sufficient. But if we want to determine how we might change the current economy to make it hold up better against the forces it is facing, we need a more complex model that explains the economy’s real problems as we reach limits. We need a model that tells the correct shape of the curve, as well as the approximate timing. I suggest reading my recent post regarding complexity and its effects as background for this post.
The common lay interpretation of simple models is that running out of energy supplies can be expected to be our overwhelming problem in the future. A more complete model suggests that our problems as we approach limits are likely to be quite different: growing wealth disparity, inability to maintain complex infrastructure, and growing debt problems. Energy supplies that look easy to extract will not, in fact, be available because prices will not rise high enough. These problems can be expected to change the shape of the curve of future energy consumption to one with a fairly fast decline, such as the Seneca Cliff.

Figure 1. Seneca Cliff by Ugo Bardi. This curve is based on writings in the 1st century C.E. by Lucius Anneaus Seneca, “It would be of some consolation for the feebleness of our selves and our works if all things should perish as slowly as they come into being; but as it is, increases are of sluggish growth, but the way to ruin is rapid.”
It is not intuitive, but complexity-related issues create a situation in which economies need to grow, or they will collapse. See my post, The Physics of Energy and the Economy. The popular idea that we extract 50% of a resource before peak, and 50% after peak will be found not to be true–much of the second 50% will stay in the ground.
Some readers may be interested in a new article that I assisted in writing, relating to the role that price plays in the quantity of oil extracted. The article is called, “An oil production forecast for China considering economic limits.” This article has been published by the academic journal Energy, and is available as a free download for 50 days.
A Simple Model Works If All We Are Trying to Do Is Make a Rough Estimate of the Date of the Downturn
Are we like the team that Dennis Meadows headed up in the early 1970s, simply trying to make a ballpark estimate of when natural resource limits are going to become a severe problem? (This analysis is the basis of the 1972 book, Limits to Growth.) Or are we like M. King Hubbert, back in 1956, trying to warn citizens about energy problems in the fairly distant future? In the case of Hubbert and Meadows, all that was needed was a fairly simple model, telling roughly when the problem might hit, but not necessarily in what way.
I have criticized Hubbert’s model for being deficient in some major respects: leaving out complexity, leaving out entropy, and assuming a nearly unlimited supply of an alternate fuel. Perhaps these issues were not important, however, if all he was trying to do was warn people of a distant future issue.

Figure 2. Slide 29 from my complexity presentation at the 2016 Biophysical Economics Conference. Hubbert’s model omitted complexity, entropy.
The model underlying the 1972 book, Limits to Growth, was also quite simple. Ugo Bardi has used this image by Magne Myrtveit to represent how the 1972 Limits to Growth model worked. It does not include a financial system or debt.
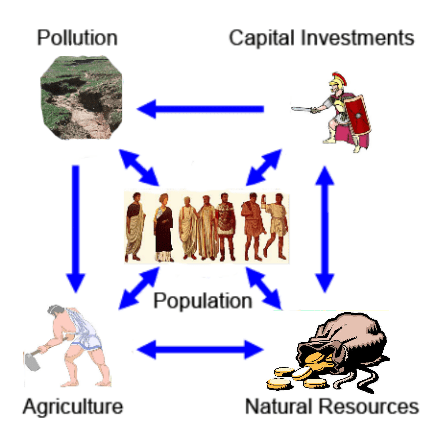
Figure 3. Image by Magne Myrtveit to summarize the main elements of the world model for Limits to Growth.
As such, this model does not reflect the major elements of complexity, which I summarized as follows in a recent post:
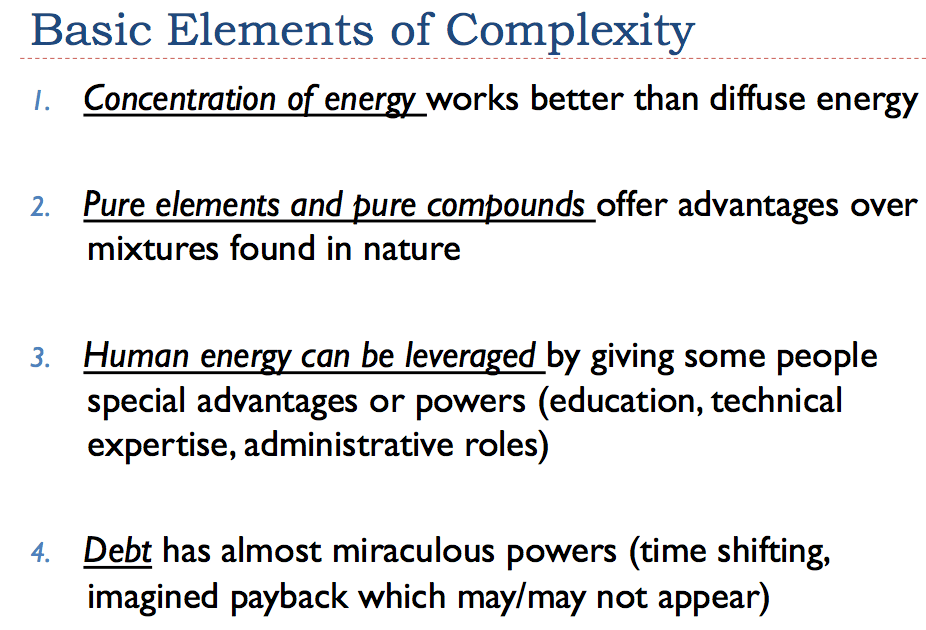
Figure 4. Slide 7 from my recent complexity presentation. Basic Elements of Complexity
Thus, the model does not forecast the problems that can be expected to occur with increasingly hierarchical behavior, including the problems that people who are at the bottom of the hierarchy can be expected to have getting enough resources for basic functions of life. These issues are important, because people at the bottom of the hierarchy are very numerous. They need to be fed, clothed, housed, and have transportation to work. All of these things take natural resources, including energy products. If the benefit of available natural resources doesn’t make it all of the way down to the bottom of the hierarchy, death rates spike. This is one of the forces that can be expected to change the shape of the curve.

Figure 5. Slide 17 from my complexity presentation. People at the bottom of a hierarchy are most vulnerable.
Dennis Meadows does not claim that the model that his group put together will show anything useful about the “shape” of the collapse. In fact, in an article about a year ago, I cut off part of the well-known Limits to Growth forecast to eliminate the part that is likely not particularly helpful–it just shows what their simple model indicates.

Figure 6. Limits to Growth forecast, truncated shortly after production turns down, since modeled amounts are unreliable after that date.
Anthropologist Joseph Tainter’s View of Collapse
If we read what anthropologist Joseph Tainter says in his book, the Collapse of Complex Societies, we find that he doesn’t consider “running out” to be the cause of collapse. Instead, he sees growing complexity to be what leads an economy to collapse. These are two of the points Tainter makes regarding complexity:
- Increased complexity carries with it increased energy costs per capita. In other words, increased complexity is itself a user of energy, and thus tends to drain away energy availability from other uses. Thus, in my opinion, complexity will make the system fail more quickly than the Hubbert model would suggest–the complexity part of the system will use part of the energy that the Hubbert model assumes will be available to fund the slow down slope of the economy.
- Increased investment in complexity tends to reach declining marginal returns. For example, the first expressway added to a highway system adds more value than the 1000th one. Eventually, if countries are trying to create economic growth where little exists, governments may use debt to fund the building of expressways with practically no expected users, simply to add job opportunities.
Ugo Bardi quotes Joseph Tainter as saying,
“In ancient societies that I studied, for example the Roman Empire, the great problem that these economies faced was that they eventually would incur very high costs just to maintain the status quo. They would need to invest very high amounts to solve problems that didn’t yield a net positive return; instead these investments simply allowed the economies to maintain the level that they were at. This increasing cost of maintaining the status quo decreased the net benefit of being a complex society.”
View of Collapse Based on a Modeling Approach
In the book Secular Cycles, Peter Turchin and Surgey Nefedov approach the problem of what causes civilizations to collapse using a modeling approach. According to their analysis, the kinds of things that caused civilizations to collapse very much corresponded to the symptoms of increasing complexity:
- Problems tended to develop when the population in an area outgrew its resource base–either the population rose too high, or the resources become degraded, or both. The leaders would adopt a plan, which we might consider adding “complexity,” to solve the problems. Such a plan might include raising taxes to be able to afford a bigger army, and using that army to invade another territory. Or it might involve a plan to build irrigation, so that the current land becomes more productive. A modern approach might be to increase tourism, so that the wealth obtained from tourists can be traded for needed resources such as food.
- According to Turchin and Nefedov, one problem that arises with the adoption of the new plan is increased wealth disparity. More leaders are needed for the new complex solutions. At the same time, it becomes more difficult for those at the bottom of the hierarchy (such as new workers) to obtain adequate wages. Part of the problem is the underlying problem of too many people for the resources. Thus, for example, there is little need for new farmers, because there are already as many farmers as the land can accommodate. Another part of the problem is that an increasing share of the output of the economy is taken by people in the upper levels of the hierarchy, leaving little for low-ranking workers.
- Food and other commodity prices may temporarily spike, but there is a limit to what workers can pay. Workers can only afford more, if they take on more debt.
- Debt levels tend to rise, both because of the failing ability of workers to pay for their basic needs, and because governments need funding for their major projects.
- Systems tend to collapse because governments cannot tax the workers sufficiently to meet their expanded needs. Also, low-ranking workers become susceptible to epidemics because they cannot obtain adequate nutrition with low wages and high taxes.
How Do We Fix an Overly Simple Model?
The image shown in Figure 3 in some sense shows only one “layer” of our problem. There is also a financial layer to the system, which includes both debt levels and price levels. There are also some refinements needed to the system regarding who gets the benefit of energy products: Is it the elite of the system, or is it the non-elite workers? If the economy is not growing very quickly, one major problem is that the workers at the bottom of the hierarchy tend to get squeezed out.

Figure 7. Author’s depiction of changes to non-elite workers’ share of the output of economy, as costs for other portions of the economy keep rising. The relative sizes of the various elements may not be correct; the purpose of this chart is to show a general idea, not actual amounts.
Briefly, we have several dynamics at work, pushing the economy toward collapse, rather than the resources simply “running out”:
- Debt tends to rise much faster than GDP, especially as increasing quantities of capital goods are added. Added debt tends to reach diminishing returns. As a result, it becomes increasingly difficult to repay debt with interest, creating a major problem for the financial system.
- The cost of resource extraction tends to rise because of diminishing returns. Wages, especially of non-elite workers, do not rise nearly as quickly. These workers cannot afford to buy nearly as many homes, cars, motorcycles, and other consumer goods. Without this demand for consumer goods made with natural resources, prices of many commodities are likely to fall below the cost of production. Or prices may rise, and then fall back, causing serious debt default problems for commodity producers.
- Because of growing complexity of the system, the “overhead” of the system (including educational costs, medical costs, the wages of managers, the cost of government programs, and the cost of resource extraction) tends to increase, leaving less for wages for the many non-elite workers of the world. With lower wages, the non-elite workers can afford less. This dynamic tends to push the system toward collapse as well.
The following is a list of variables that might be added to the overly simple model.
- Debt. As capital goods are added to work around resource shortages, debt levels will tend to rise quickly, because workers need to be paid before the benefit of capital goods can be obtained. Debt levels also rise for other reasons, such as government spending without corresponding tax revenue, and funding of purchases deemed to have lasting value, such as college educations and investments in research and development.
- Interest rates are the major approach that politicians have at their disposal to try to influence debt levels. In general, the lower the interest rate, the cheaper it is to buy cars, homes, and factories on credit. Thus, the amount of debt can be expected to rise as politicians lower interest rates.
- Wages of non-elite workers. Non-elite workers play a dual role: (a) they are the primary creators of the goods and services of the system, and (b) they are the primary buyers of the goods that are made using commodities, such as food, clothing, homes, and transportation services. Thus, their wages tend to determine whether the economy can grow. In general, we would expect wages of workers to rise, if their wages are being supplemented by more and more fossil fuel energy in the form of bigger and better machinery to help the workers produce more goods and services. If the wages of non-elite workers fall too low, we would expect the economy to slow, and commodity prices to fall. To some extent, rising debt (through manipulation of interest rates, or through government spending in excess of tax revenue) can be used to supplement the wages of non-elite workers to allow the economy to continue to grow, even if wages are stagnating.
- The affordable price level for commodities in the aggregate depends primarily on the wage level of non-elite workers and debt levels. A particular commodity may increase in price, but in the aggregate, the total “package” of costs represented by commodity prices must remain affordable, considering wage and debt levels of workers. If wage levels of non-elite workers are rising, the overall affordable price level of commodities will tend to rise. But if wage levels of non-elite workers are falling, or if debt levels are falling, affordable price levels are likely to fall.
- The required price level for commodity production in the aggregate to continue to grow at the previous rate. This required price level will depend on many considerations, including: (a) the rising cost of extraction, considering the impacts of depletion, (b) wage levels, (c) tax requirements, and (d) other needs, including payment of interest and dividends, and required funding for new development. Clearly, if the affordable price level falls below the required price level for very long, we can eventually expect total commodity production to start falling, and the economy to contract.
- The energy needs of the “overhead” of the system. Increasing complexity tends to make the overhead of the system grow much faster than the system as a whole. Energy products of various kinds are needed to support this growing overhead, leaving less for other purposes, such as to increasingly leverage the labor of human workers. Some examples of growing overhead of the system include energy needed (a) to maintain the electric grid, internet, roads, and pipeline systems; (b) to fight growing pollution problems; (c) to support education, healthcare, and financial systems needed to maintain an increasingly complex society; (d) to meet government promises for pensions and unemployment insurance; and (e) to cover the rising energy cost of extracting energy products, water, and metals.
- Available energy supply based on momentum and previous price levels. A few examples explain this issue. If a large oil project was started ten years ago, it likely will be completed, whether or not the oil is needed now. Oil exporters will continue to pump oil, as long as the price available in the marketplace is above their cost of production, because their governments need at least some tax revenue to keep their economies from collapsing. Wind turbines and solar panels that have been built will continue to produce electricity at irregular intervals, whether or not the electric grid actually needs this electricity. Renewable energy mandates will continue to add more wind turbines and solar panels to the electric grid, whether or not this electricity is needed.
- Energy that can actually be added to the system, based on what workers can afford, considering wages and debt levels [demand based energy]. Because matching of supply and demand takes place on a short-term basis (minute by minute for electricity), in theory we need a matrix of quantities of commodities of various types that can be purchased at various price levels for short time-periods, given actual wage and debt levels. For example, if more electricity is dumped on the electric grid than is needed, how much impact will a drop in prices have on the quantity of electricity that consumers are willing to buy? The intersections of supply and demand “curves” will determine both the price and quantity of energy added to the system.
The output of the model would be three different estimates of whether we are reaching collapse:
- An analysis of whether repayment of debt with interest is reaching limits.
- An analysis of whether affordable commodity prices are falling below the level needed for commodity consumption to grow, likely leading to falling future commodity production.
- An analysis of whether net energy per capita is falling. This would reflect a calculation of the following amount over time:
 If net energy per capita is falling, the ability to leverage human labor is falling as well. Thus productivity of human workers is likely to stop growing, or perhaps decline. The total amount of goods and services produced is likely to plateau or fall, leading to stagnating or declining economic growth.

The important thing about the added pieces to this model is that they emphasize the one-way nature of the system. The economy needs to grow, or it collapses. The price of energy products cannot rise much at all, because wages of workers don’t rise correspondingly. This means that any energy substitute must be very cheap. The system needs to keep adding debt, especially when capital goods are added. The benefit of this debt reaches diminishing returns. The combination of these diminishing returns with respect to investments made with debt, and the interest that needs to be paid on debt, means that it is very difficult for energy products based on capital goods to “save” the system.
Complexity Adds Unforeseen Problems
One issue that people working solely in the energy sector may not notice is that our current system for setting market-based electricity prices is not working very well, with the addition of feed-in tariffs and other subsidy programs. There is evidence that subsidizing renewable electricity tends to lead to falling wholesale electricity prices. In a sense, if we subsidize electricity prices for one type of electricity producer, we find it also necessary to subsidize electricity prices for other types of electricity producers. (Also in California.)

Figure 8. Residential Electricity Prices in Europe, together with Germany spot wholesale price, from http://pfbach.dk/firma_pfb/references/pfb_towards_50_pct_wind_in_denmark_2016_03_30.pdf
Inadequate prices for electricity producers and a need for ever-rising subsidies for electricity production could, by themselves, cause the system to fail. In a sense, this pricing problem is a complexity-related outcome that economists have overlooked. Their models are also too simple!
Conclusion
It is easy to rely on too-simple models. Perhaps the biggest issue that is missed is that energy prices can’t rise endlessly. Because of this, a large share of natural resources, including oil and other energy products, will be left in the ground. Furthermore, because prices do not rise very high, energy products that are expensive to produce can’t be expected to work, either, no matter how they are disguised. Substitutes that cannot be inexpensively integrated into the electric grid are not likely to work either.
I talked about low-ranking workers being a vulnerable part of the system. It is clear from Joseph Tainter’s comments that another vulnerable part of our current system is the various “connectors” that allow us to have our modern economy. These include the electric grid, roads and bridges, the pipeline systems, the water and sewer systems, the internet, the financial system, and the international trade system. Even government organizations such as the Eurozone might be considered vulnerable connecting systems. The energy cost of maintaining these systems can be expected to continue to rise. Rising costs for these systems are part of what makes it difficult to maintain our current economic system.
The focus on “running out” has led to a focus on finding ways to extend our energy supply with small quantities of high-priced alternatives. This approach doesn’t really get us very far. What we need to keep the economy from collapsing is a growing supply of cheap-to-produce energy and other natural resources. Ideally, these new resources should require little debt, and not cause pollution problems. These requirements are exceedingly difficult to meet in a finite world.

Pingback: How Peak Oil Was Misunderstood in the previous years
“Eventually companies are going to react in large numbers. They’re either going to perform miracles and get their sales to jump through hoops, or if that fails, they’re going to bring their workforce in line with their lower sales.”
http://wolfstreet.com/wp-content/uploads/2016/08/US-jobs-v-business-sales-2006-2016-07.png
http://wolfstreet.com/2016/08/09/employment-growth-despite-declining-sales-and-productivity/
Yep – at some point the layoffs are going to arrive… big time
“We believe there are multiple drivers behind the recent slowdown, but the most notable reason appears to be the continued gap between the cost of eating at home and the cost of dining out, which is now at its widest point since the recession.”
In other words, it has been getting more expensive to eat out, and squeezed consumers are reacting by eating out less.
“And it’s at a time where we’re still not seeing real wage growth….”
The Bureau of Labor Statistics just revised its numbers, reporting that inflation-adjusted hourly compensation in the first quarter had actually fallen by an annual rate of -0.4% from the fourth quarter, instead of the previously reported jump of +4.2%, and that in the second quarter, it had fallen another -1.1%.
Wendy’s CEO Blames Rising Inflation, Falling Wages, Election Mayhem for Restaurant Sector “Slowdown”
by Wolf Richter • August 10, 2016
Share on FacebookTweet about this on TwitterShare on LinkedInShare on Google+Share on RedditPrint this pageEmail this to someone
Consumers at the “low end” are tapped out.
Restaurants are considered a leading indicator of the economy into a downturn. The theory is that restaurant revenues are slowing when consumers, whose spending accounts for about 70% of GDP, start having trouble with their wallets.
Some call the current situation a “restaurant recession.” Wendy’s, in its earnings call today, calls it a “recent slowdown.”
Others don’t see it that way quite yet. If you’re trying to walk into one of the amazing restaurants in San Francisco on a Saturday night, you might be disappointed when you find out that the “restaurant recession” has failed to reserve a table for you.
The Restaurant Performance Index, released at the end of July, was equally ambivalent. Business isn’t falling off a cliff yet, but it doesn’t look good either, with the overall index having declined to 100.3 in June (above 100 = expansion), “as a result of softer sales and a dampened outlook among operators.”
“The uneven trend” in the first half, it said, “was due in large part to choppy same-store sales and customer traffic results.”
The Expectations Index fell to 100.7, barely positive, as restaurant operators remained vaguely hopeful that the next six months will get better. But the Current Situation Index, the reality check, fell into contraction mode (99.9), as restaurant operators, for the second month in a row, “reported a net decline in same-store sales and customer traffic.”
This is the struggle in the QSR sector – “quick service restaurants,” as the fast-food industry likes to call itself more appealingly. Today it was Wendy’s CEO Todd Penegor who shed some light on this in the earnings call (transcript via Seeking Alpha):
“Wendy’s brand is poised for success, even in a challenging environment,” he said as revenues plunged 22% in Q2 to $383 million, “primarily” caused by the sale of 361 company restaurants to franchise operators. Same-restaurant sales edged up a measly 0.4% in North America. Net income plunged 34%.
These results “came in lower than we’d anticipated,” Penegor said. But he had “confidence for the rest of the year.” Wall Street wasn’t enthusiastic. Shares plunged 6.3% by mid-morning before ending the day down 2.8%.
Then he took some time out “to talk about the QSR industry and what we have observed in relation to the recent slowdown.” He showed this uninspiring fast-food-industry traffic chart:
US-Wendys-QSR-traffic
And added:
“We believe there are multiple drivers behind the recent slowdown, but the most notable reason appears to be the continued gap between the cost of eating at home and the cost of dining out, which is now at its widest point since the recession.”
In other words, it has been getting more expensive to eat out, and squeezed consumers are reacting by eating out less.
In the Q&A, he provided some additional gems of information. It’s about three times more expensive to eat at a fast-foot joint than at home, he said:
“And when a consumer is a little uncertain around their future and really trying to figure out what this election cycle really means to them, they’re not as apt to spend as freely as they might have even just a couple of quarters ago.”
So that’s the overall uncertainty, the angst about the future for regular folks in the Fed-engineered economy. Then there’s money:
“And it’s at a time where we’re still not seeing real wage growth….”
The Bureau of Labor Statistics just revised its numbers, reporting that inflation-adjusted hourly compensation in the first quarter had actually fallen by an annual rate of -0.4% from the fourth quarter, instead of the previously reported jump of +4.2%, and that in the second quarter, it had fallen another -1.1%.
Penegor, with his excellent view of the real economy as it walks into his restaurants, hit the nail (softly) on the head, when he said that “we’re still not seeing real wage growth.” And he went on:
“But we are seeing some of the cost of living move up when you get into what it costs to own an home and operate your life in general.”
http://wolfstreet.com/2016/08/10/wendys-ceo-blames-rising-inflation-falling-wages-election-mayhem-for-restaurant-sector-slowdown/
Eating out? I do this only on special occasions. Who would do that regularly and pay a lot for mostly crap food? Even the time of going to a halve decent Restaurant, ordering, waiting, eating and going back to ones home is not even a time saver.
So true. Just got back from a few days in Europe and as ever it was a constant struggle to find anything healthy to eat. Restaurants, sandwich shops, etc. all have the same aim of selling cheap ingredients (mostly carbs) as expensively as possible.
@Yorchichan
Thats the reason I carry always my own food with me…
Carbs are o.k. and essential (your brain runs on it 🙂 The problem is that you mostly get only refined carbs… sugar, white rice, white flour, but not black/brown rice, whole spelt, sweet potatoes or regular potatoes steamed “al-dente”.
I go mostly for Thai restaurants or “fast-food” – its a compromise – but you have to say that you don’t want the “white powder” on it… Glutamate… less salt and no fish-sauce or oil in the pan (should use water for the vegetables).
I used to get a full check up at Bumungrad Hospital in Bangkok …I recall a chat with the doctor about Thai food …. she said that most people who came through the door thought Thai food was very healthy — when in fact it is loaded with sugar and sodium… making it one of the least healthy unprocessed cuisines….
Its a general problem.. to much salt everywhere… I prepare approx. 95% of my food myself… from scratch… always fresh… always from base ingredients.. basically nothing pre-processed…. I basically use no salt at all, except for fermented foods -> preserving cabbage -> sauerkraut… and an occasional slice of full grain bread.
But I a cuisines which is quite widely available… and “better” than Thai… nothing comes to my mind there….
How in the world did they get the original +4.2%?
Pingback: How Peak Oil Was Misunderstood - Monetary Watch
Pingback: How Peak Oil Was Misunderstood – Enjeux énergies et environnement