Reaching the end of offshored industrialization

Moving industrialization offshore can look like a good idea at first. But as fossil fuel energy supplies deplete, this strategy works less well. Countries doing the mining and manufacturing may be less interested in trading. Also, the broken supply lines of 2020 and 2021 showed that transferring major industries offshore could lead to empty shelves in stores, plus unhappy customers.

The United States started moving industry offshore in 1974 (Figure 1) in response to spiking oil prices in 1973-1974 (Figure 2).

Figure 1. US industrial energy consumption per capita, divided among fossil fuels, biomass, and electricity, based on data from the US Energy Information Administration (EIA). All energy types, including electricity, are measured their capacity to generate heat. This is the approach used by the EIA, the IEA, and most researchers.

Industry is based on the use of fossil fuels. Electricity also plays a role, but it is more like the icing on the cake than the basis of industrial production. Industry is polluting in many ways, so it was an “easy sell” to move industry offshore. But now the United States is realizing that it needs to re-industrialize. At the same time, we are being told about the need to transition the entire economy to electricity to prevent climate change.

In this post, I will try to explain the situation–how fossil fuel prices have spiked many times, including 1973-1974 (oil) and more recently (coal in 2022). I will also discuss the key role fossil fuels play. Because of the key role of fossil fuels, a reduction in per-capita fossil fuel consumption likely leads to a transition to fewer goods and services, on average, per person. A transition to all electricity does not seem to be feasible. Instead, we seem to be headed for increased geopolitical conflict and the possibility of a financial crash seems greater.

[1] When fossil fuel supplies become constrained, prices tend to spike to high levels, and then fall back again.

Economists and energy analysts have tended to assume that fossil fuel prices would rise to very high levels, allowing extraction of huge amounts of difficult-to-extract fossil fuels. For example, the International Energy Agency (IEA) in the past has shown forecasts of future oil production assuming that inflation-adjusted oil prices will rise to $300 per barrel.

Instead of rising to a very high level, fossil fuel prices tend to spike because there is a two-way contest between the price the consumers can afford and the price the sellers need to keep reinvesting in new fields to keep fossil fuel supplies increasing. Prices oscillate back and forth, with neither buyers nor sellers finding themselves very happy with the situation. The current price of the benchmark, Brent oil, is $81.

[2] Historical data shows spiking oil and coal prices.

Figure 2. World oil prices, adjusted to the US 2022 price level, based on data of the 2023 Statistical Review of World Energy, prepared by the Energy Institute.

When world oil prices started to spike in the 1973-1974 period, the US started to move its industrial production offshore (Figure 1). The very low inflation-adjusted prices that prevailed up until 1972 no longer held. Manufacturing costs climbed higher. Consumers wanted smaller, more fuel-efficient vehicles, and such cars were already being manufactured both in Europe and in Japan. Importing these cars made sense.

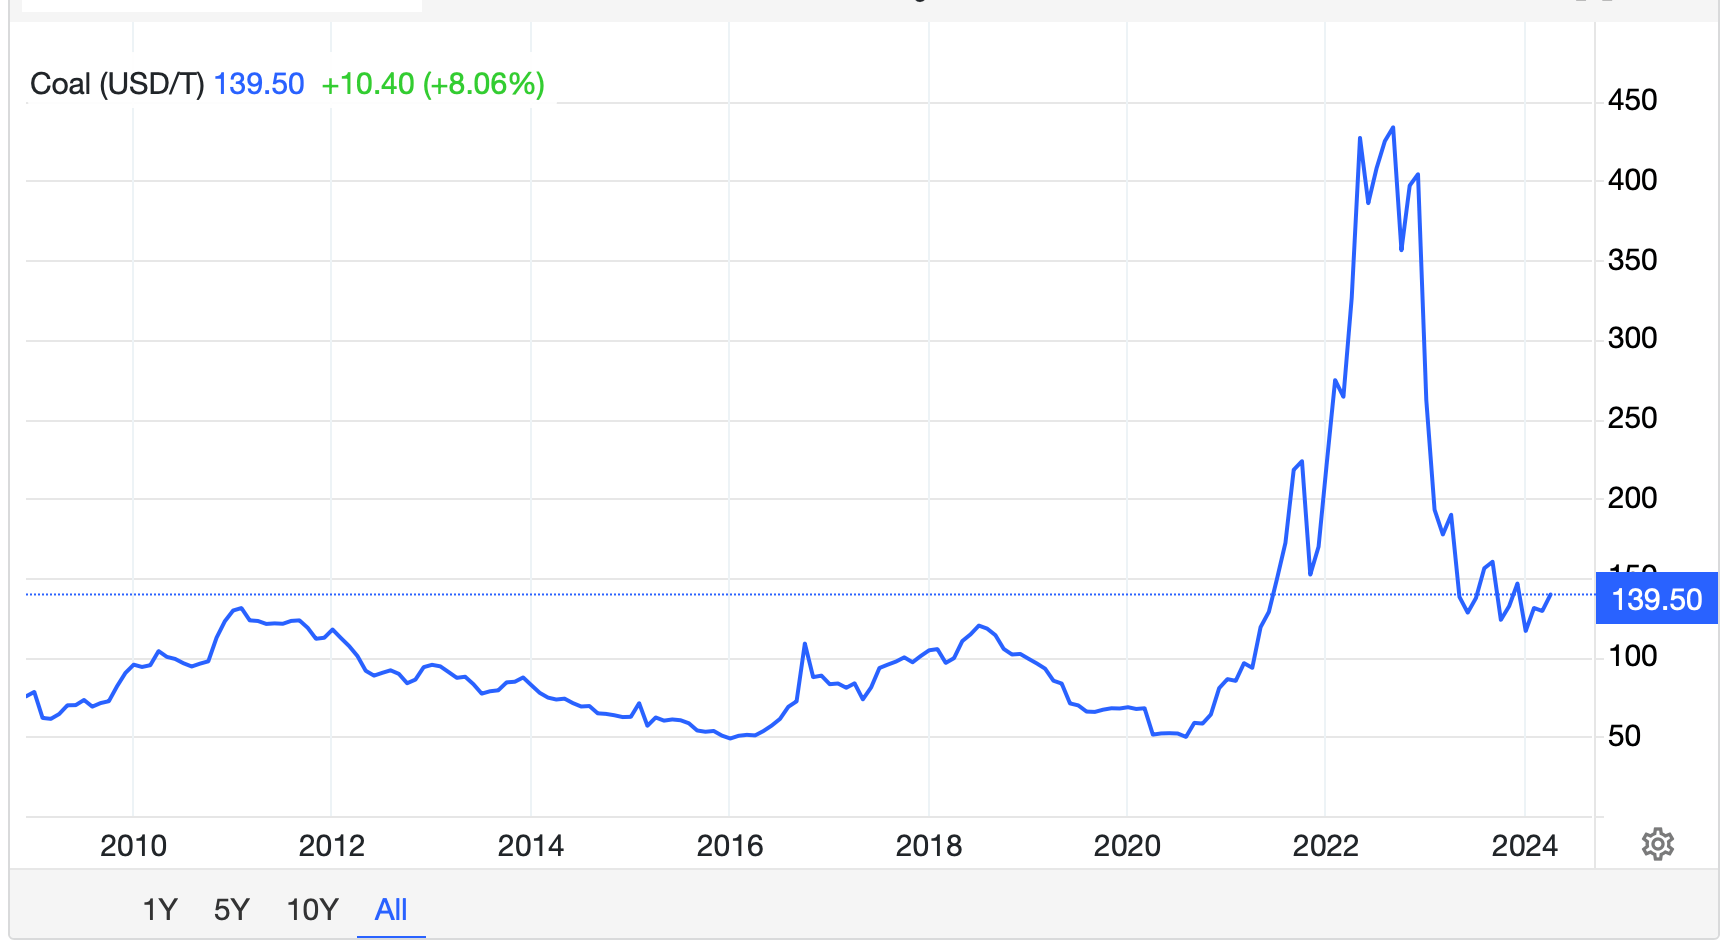
More recently, coal prices have begun to spike. Coal prices vary by location, but the general patterns are similar for the types of coal shown.

Figure 3. Coal prices per ton, at a few sample locations, based on data shown in the 2023 Statistical Review of World Energy prepared by the Energy Institute. Prices have not been adjusted for inflation.

Before China joined the World Trade Organization (WTO) in 2001, coal prices tended to be below $50 per ton (figure 3). At that price, coal was a very inexpensive fuel for making steel and concrete, and for many other industrial uses.

Figure 4. World coal consumption per capita, based on data of the 2023 Statistical Review of World Energy prepared by the Energy Institute, except for 2023, which is based on an estimate by the IEA.

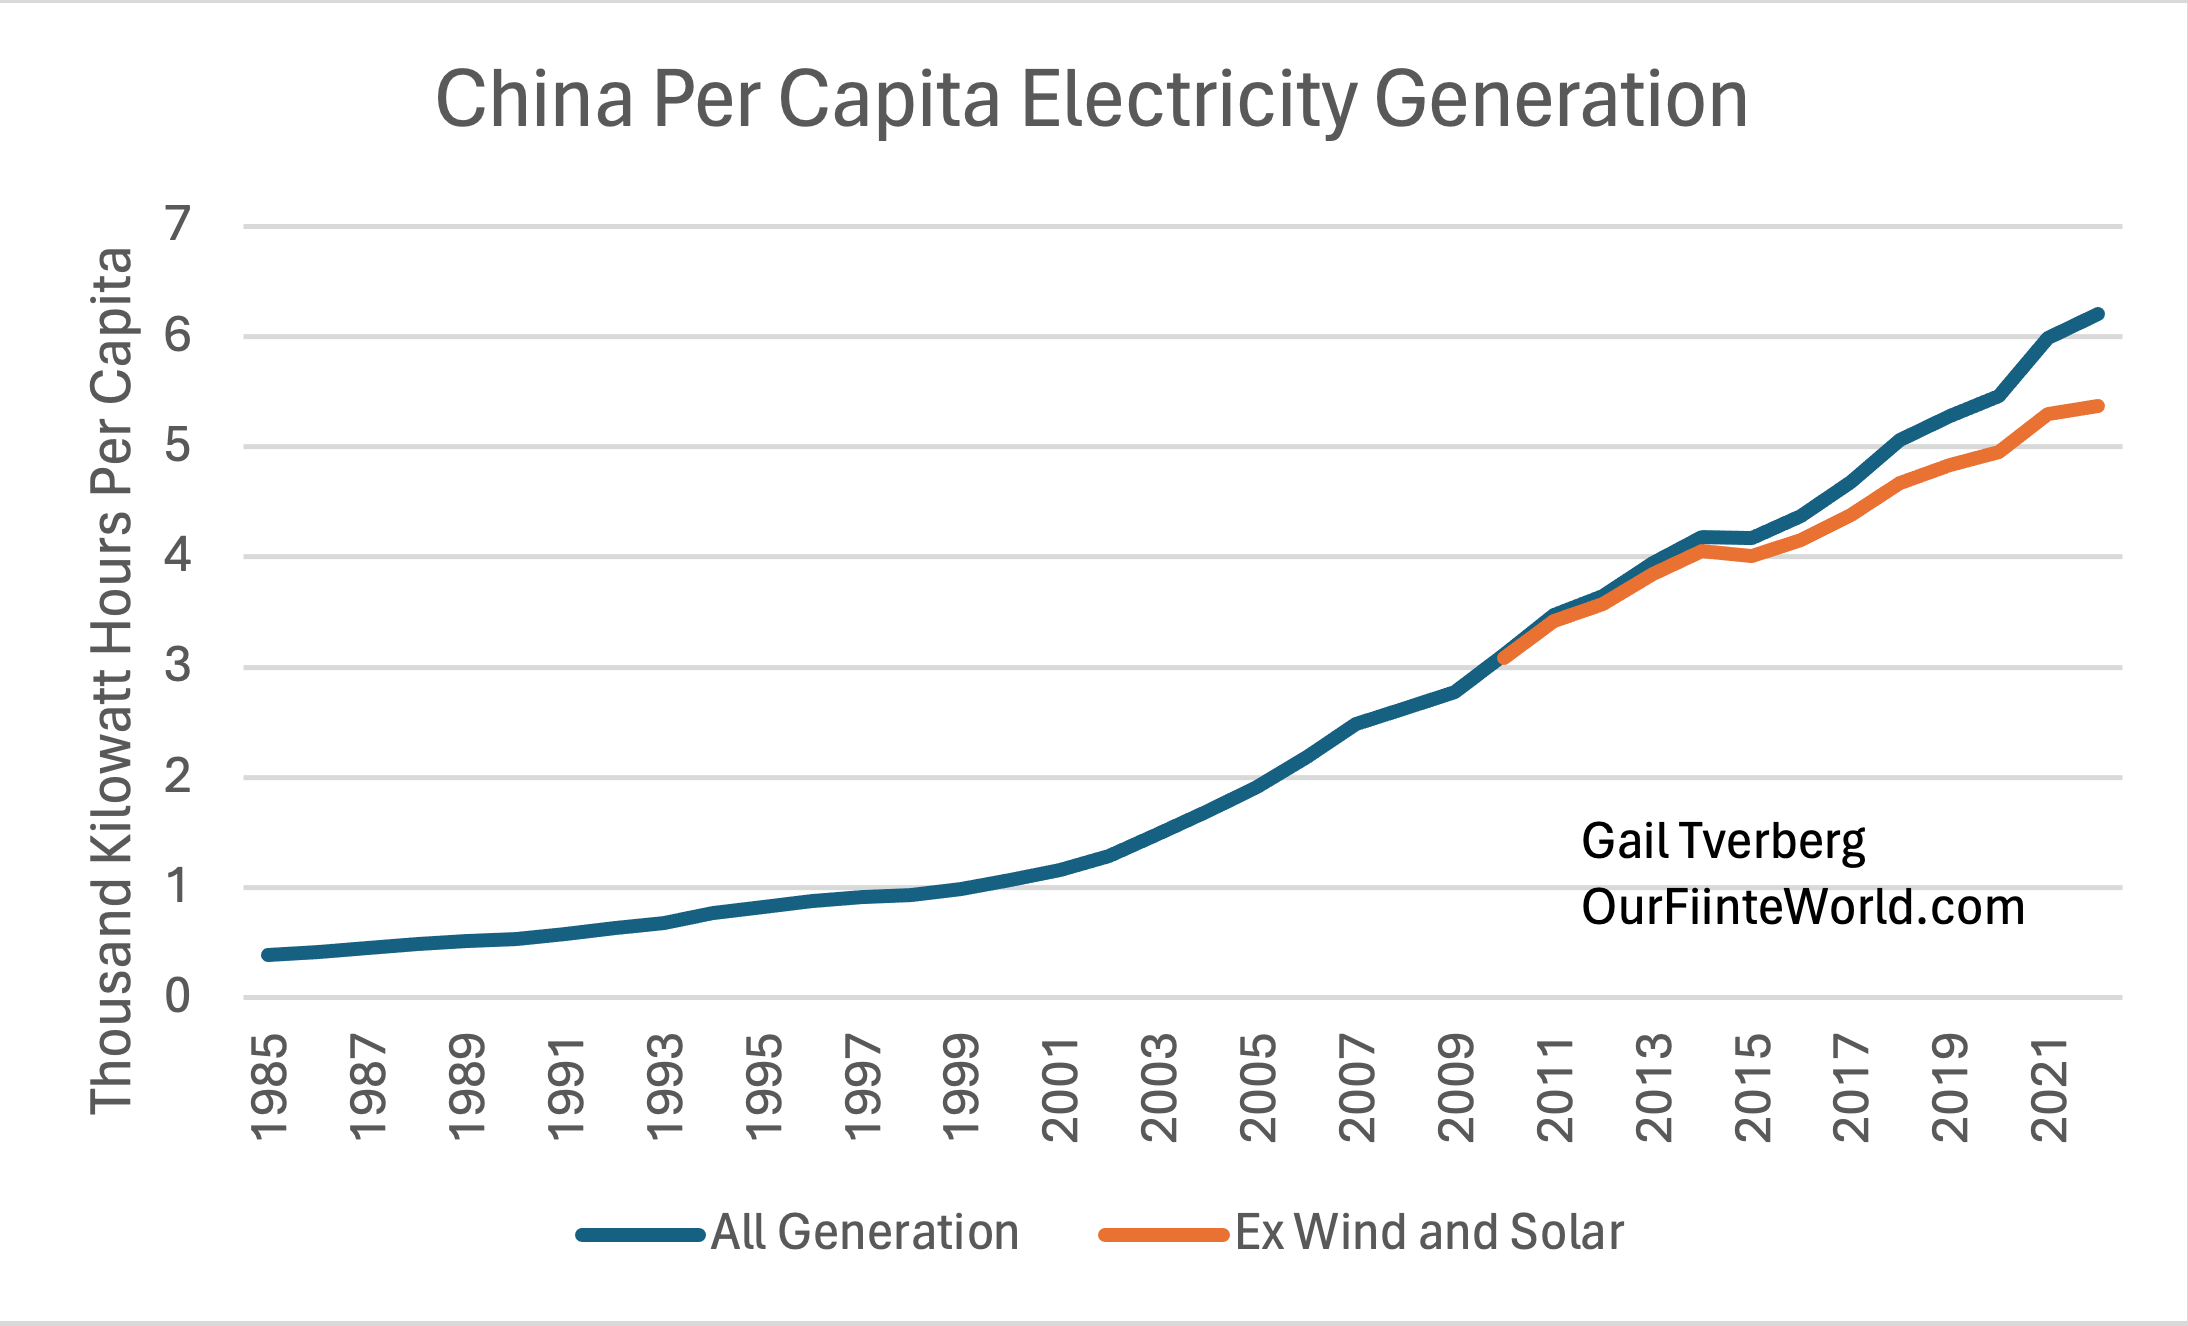
After China joined the WTO, China’s coal consumption soared (Figure 4), allowing it to industrialize. Figure 3 shows that the extra demand initially pushed coal prices up a little. By 2022, coal prices had soared. At present, coal prices are part-way back down, perhaps partly because higher interest rates are dampening world demand for coal.

Natural gas prices also soared in 2022, at the same time as coal prices. Both coal and natural gas are fuels that are burned to produce electricity. When the coal supply is constrained, utilities will try to purchase more electricity produced by burning natural gas. However, it is difficult to store much natural gas for future use. Thus, a shortage of internationally traded coal can simultaneously lead to a shortage of internationally traded natural gas.

Having oil, coal, and natural gas prices spiking at the same time leads to inflation and to many unhappy citizens.

[3] The 1997 Kyoto Protocol encouraged the trend toward moving industry to lower-cost countries.

In Figure 1, I show a dotted line at 1997. At that time, an international treaty stating that the participating countries would limit their own CO2 emissions attracted a lot of attention. An easy way to limit CO2 emissions was by moving industry overseas. Even though the US did not sign the treaty until later, the treaty gave the US a reason to move industry overseas. We can see from Figure 1 that US industrialization, as measured by the energy per capita required to industrialize, began to fall even more rapidly after 1997.

[4] There were many reasons besides the Kyoto Protocol why Advanced Economies would want to move industry overseas.

There were many reasons to move industry overseas besides spiking oil prices and concern over CO2 levels. With such a change, customers in the US (and European countries making a similar change) gained access to lower-cost goods and services. With the money the customers could save, they were able to buy more discretionary goods and services, which helped to ramp up local economies.

Also, industry tends to be polluting. Smog tends to be problem if coal is burned, or if diesel with high sulfur content is burned. Mining tends to produce a lot of toxic waste. Moving this pollution offshore to poorer countries would solve the pollution problem without the high cost of attempting to capture this pollution and properly store it.

Furthermore, business-owners in the United States could sense the opportunity to grow to be truly international in size if they moved much of their industry overseas.

[5] All the globalization and moving of industry overseas had a downside: more wage and wealth disparity.

In a matter of a few years, the economy changed to provide fewer high-paying factory jobs in the United States. Increasingly, those without advanced education found it difficult to provide an adequate living for their families. The high incomes were disproportionately going to highly educated workers and the owners of capital goods (Figure 5).

Figure 5. U. S. Income Shares of Top 1% and Top 0.1%, Wikipedia exhibit by Piketty and Saez.

[6] Part of what caused the growing wage and wealth disparities in Figure 5 was the growing industrialization of China (Figure 6).

China, with its growing industrialization, could outcompete whole industries, such as furniture-making and garment-making, leaving US workers to find lower-paid jobs in the service sector. Similar outcomes unfolded in the EU and Japan, as industrialization started moving to different parts of the world.

Figure 6. Industrial production in 2015 US$, for the United States, the EU, Japan, and China, based on World Bank Industrial Production (including construction) data. These amounts are not per capita.

[7] The indirect impact of the Kyoto Protocol was to move CO2 emissions slightly away from the Advanced Nations. Overall, CO2 emissions rose.

Chart showing CO2 emissions from fossil fuels, split between Advanced Economies and Other than Advanced Economies, based on data from the 2023 Statistical Review of World Energy by Energy Institute.
Figure 7. Carbon dioxide emissions from energy utilization, based on data of theĀ 2023 Statistical Review of World Energy, prepared by the Energy Institute. These amounts are not per capita.

Anyone who expected that the 1997 Kyoto Protocol would reduce world CO2 emissions would have been disappointed.

[8] The direct use of fossil fuels plays a far more important role in the economy than we have ever been taught.

Thanks to the direct use of fossil fuels, the world can have paved roads, bridges made of steel, and electricity transmission lines. It can have concrete. It can have pharmaceutical products, herbicides, and insecticides. Many of these benefits come from the chemical properties of fossil fuels. Electricity, by itself, could never provide these products since it has been stripped of the chemical benefits of fossil fuels. Electricity is also difficult to store.

With the benefit of fossil fuels, the world can also have high-quality steel, with precisely the composition desired by those making it. With only electricity, it is possible to use electric arc furnaces to recycle used steel, but such steel is limited both in quantity and quality. US production of steel amounts to 5% of world supply (primarily using electric arc furnaces), while China’s production (mostly using coal) amounts to 50% of world supply.

I highly recommend reading the article, Trapped in the Iron Age, by Kris De Decker. He explains that the world uses an enormous amount of steel, but most of it is hidden in places we can’t see. Today, with the US’s limited steel-making capability, the US needs to import most of its steel, including steel pipes from China to drill its oil wells. We cannot see how dependent we have become on other countries for our basic steel needs.

China and India have both based their recent growth primarily on rising coal consumption. This is what has kept world CO2 emissions high. The US is now exporting coal to these countries.

[9] Citizens of Advanced Economies are easily confused about the importance of fossil fuel use because they have never been taught about the subject and because their worldview is distorted by the narrow view they see from within their homes and offices.

Figure 8. Electricity consumption as a percentage of total energy consumption by US sector, based on the data of the US EIA. Amounts are through 2023.

Figure 8 shows that the sector with the highest share of electricity use is the commercial sector. This includes uses such as stores, offices, and hospitals. The most visible energy use is lighting and operating computers, which gives the perception that electricity is the greatest energy use. But these businesses also need to be heated, and heat is often produced by burning natural gas directly. Businesses also need back-up for their electrical systems. Such back-up is typically provided by diesel-powered generators.

Residential usage is similar. It is easy to see the use of electricity, but heat is generally needed during winter. This is often provided by natural gas or propane. Natural gas is also often used in hot water heaters, stoves, and clothes dryers. Occasionally, wood is used to heat homes; this would go into the non-electricity portion, as well.

The thing that most people do not realize is that industrial use and transportation use are extremely large sectors of the economy (Figure 9), and these sectors are very low consumers of electricity (Figure 8). Also, if the US and Europe were to re-industrialize to produce more of our manufactured goods, our industrial sectors would need to be much larger than they are today.

Figure 9. US Energy Consumption per capita by sector based on data of the US EIA. Amounts are through 2023.

In recent years, electrical consumption as a percentage of total energy consumption for the industrial sector has averaged about 13% of the total (Figure 9). Industries typically need high heat levels; such heat can usually be achieved at lowest cost by burning fossil fuels directly. Wikipedia claims, “Electric arc steelmaking is only economical where there is plentiful, reliable electricity, with a well-developed electrical grid.” An electric grid, powered only by intermittent electricity from wind turbines and solar panels, would not qualify.

In Figure 8, electricity consumption as a percentage of total energy consumption for the US transportation sector rounds to 0%, for every year. Even the amount of biomass (ethanol and biodiesel) used by the transportation sector doesn’t have much of an impact, as shown in Figure 10.

Figure 10. US transportation energy by type through 2023, based on data of the US EIA. Biomass includes ethanol and any biofuels made to substitute for diesel.

A major issue is that transportation is a broad sector, including trucks, trains, planes, and boats, in addition to private passenger autos. Also, I expect that the only electricity that would be considered in the transportation energy calculation would be electricity purchased from an away-from-home charging facility. Electricity used when charging at home would likely be part of residential electricity consumption.

[9] The narrative saying that we can transition to an electricity-only economy, powered by intermittent wind and solar electricity, has major holes in it.

One major issue is that the pricing of wind and solar tends to drive out other electricity providers, particularly nuclear. Intermittent wind and solar are given “priority” when they are available. This leads to very low or negative prices for other electricity providers. Nuclear is particularly affected because it cannot ramp up and down, in response to prices that are far below its cost of production.

Nuclear is a far more stable source of electricity than either wind or solar, and it is also a low-carbon source. As a result, economies end up worse off, in terms of electricity supply per capita, and in stability of available supply, when wind and solar are added.

Figure 11. US per capita electricity generation based on data of the US Energy Information Administration. (Amounts are through 2023.)
Figure 12. Electricity generation per capita for the European Union based on data of the 2023 Statistical Review of World Energy, prepared by the Energy Institute. Amounts are through 2022.

Another issue is that wind turbines and solar panels are made with fossil fuels and repaired using fossil fuels. Without fossil fuels, we cannot maintain electricity transmission lines and roads. Thus, wind turbines and solar panels are as much a part of the fossil fuel system as hydroelectric electricity and electricity made from coal or natural gas.

Also, as discussed above, only a small share of the economy is today operated using electricity. The IEA says that 20% of 2023 world energy supply comes from electricity. The amounts I calculated as “Overall” in Figure 8 indicate an electricity share of 18%, which is a bit less than the IEA is indicating for the world. Figure 8 shows an early upward trend in this ratio, but no upward trend since 2012. Fossil fuels are being used today because they have chemical characteristics that are needed or because they provide the energy services required in a less expensive manner than electricity.

Even in the early days of the Industrial Revolution, wind and waterpower provided only a small portion of the total energy supply. Coal provided the heat energy that both industry and residences needed, inexpensively. Wind and waterpower were not well adapted to providing heat energy when needed.

Figure 13. Annual energy consumption per head (megajoules) in England and Wales 1561-70 to 1850-9 and in Italy 1861-70. Figure by Wrigley, in Energy and the English Industrial Revolution.

If we are short of inexpensive-to-extract fossil fuels, relative to today’s large population, we certainly could use some new inexpensive source of stable electricity supply. But this would not solve all our energy problems–we would still need a substantial amount of fossil fuel supplies to grow our food and keep our roads repaired. But if a new type of electricity production could reduce the demand for fossil fuels, it would make a larger quantity of fossil fuels available for other purposes.

[10] Practically everyone would like a happily-ever-after ending, so it is easy for politicians, educators, and the news media to put together overly optimistic versions of the future.

The narrative that CO2 is the world’s biggest enemy, so we need to move quickly away from fossil fuels, has received a great deal of publicity recently, but it is problematic from two different points of view:

(a) The feasibility of moving away from fossil fuels without killing off a very major portion of the world’s population seems to be virtually zero. The world economy is a dissipative structure in physics terms. It needs energy of the right kinds to “dissipate,” just as humans are dissipative structures and need food to dissipate (digest). Humans cannot live on lettuce alone, or practically any other foodstuff by itself. We need a “portfolio” of foods, adapted to our bodies’ needs. The economy is similar. It cannot operate only on electricity, any more than humans can live only on high-priced icing for cakes.

(b) The narrative about the importance of CO2 emissions with respect to climate change is quite possibly exaggerated. There are many other things that would seem to be at least as likely to cause short-term shifts in temperatures:

  • Lack of global dimming caused by less coal dust and reduced sulfur compounds in the atmosphere; in other words, reducing smog tends to raise temperatures.
  • Small changes in the Earth’s orbit
  • Changes in solar activity
  • Changes related to volcanic eruptions
  • Changes related to shifts in the magnetic north and south poles

Politicians, educators, and the news media would all like a narrative that can explain the need for moving away from fossil fuels, rather than admit that “our easy to extract fossil fuel supply is running out.” The climate change narrative has been an easy approach to highlight, since clearly the climate is changing. It also provides the view that somehow we will be able to fix the problem if we take it seriously enough.

[11] Today, we are in a period of conflict among nations, indirectly related to not having access to enough fossil fuels for a world population of 8 billion. There is also a significant chance of financial collapse.

In my opinion, today’s world is a little like the “Roaring 20s” that came shortly before a major stock market crash in 1929 and the Great Depression of the 1930s. After the Great Depression, the world entered World War II. There is huge wage and wealth disparity; energy supplies per capita are stretched.

Today, NATO and Russia are fighting a proxy war in Ukraine. Russia is a major fossil fuel producer; it would like to be paid more for the energy products it sells. Russia could perhaps get better prices by selling oil and other energy products to Asian customers instead of its current customer mix. At the same time, the US claims primary leadership (hegemony) in the world but, in fact, it needs to import many goods from overseas. It even needs supply lines from around the world for weapons being sent to Ukraine. The Ukraine conflict is not going well for the US.

I do not know how this will work out. I am hoping that there will not be a World War III, in the same way that there was a World War II. All countries are terribly dependent on each other, even though there are not enough fossil fuels to go around. Perhaps countries will try to sabotage one another, using modern techniques, such as cyber warfare.

I think that there is a substantial chance of a major financial collapse in the next few years. The level of debt is very high now. A major recession, with lots of collapsing debt, seems to be a strong possibility.

[12] A presentation I recently gave to a group of actuaries that touches on several of these issues, plus others.

My presentation can be found at this link: Beware: The Economy Is Beginning to Shrink

Posted in Energy policy, Financial Implications | Tagged , , , , | 55 Comments

The world’s economic myths are hitting limits

There are many myths about energy and the economy. In this post I explore the situation surrounding some of these myths. My analysis strongly suggests that the transition to a new Green Economy is not progressing as well as hoped. Green energy planners have missed the point that our physics-based economy favors low-cost producers. In fact, the US and EU may not be far from an economic downturn because subsidized green approaches are not truly low-cost.

[1] The Chinese people have long believed that the safest place to store savings is in empty condominium apartments, but this approach is no longer working.

The focus on ownership of condominium homes is beginning to unwind, with huge repercussions for the Chinese economy. In March, new home prices in China declined by 2.2%, compared to a year earlier. Property sales fell by 20.5% in the first quarter of 2024 compared to the same period a year ago, and new construction starts measured by floor area fell by 27.8%. Overall property investment in China fell by 9.5% in the first quarter of 2024. No one is expecting a fast rebound. The Chinese seem to be shifting their workforce from construction to manufacturing, but this creates different issues for the world economy, which I describe in Section [6].

[2] We have been told that Electric Vehicles (EVs) are the way of the future, but the rate of growth is slowing.

In the US, the rate of growth was only 3.3% in the first quarter of 2024, compared to 47% one year ago. Tesla has made headlines, saying that it is laying off 10% of its staff. It also recently reported that it is delaying deliveries of its cybertruck. A big issue is the high prices of EVs; another is the lack of charging infrastructure. If EV sales are to truly expand, they will need both lower prices and much better charging infrastructure.

[3] Many people have assumed that home solar panel sales would rise forever, but now US home solar panel sales are shrinking.

A forecast made by the trade group Solar Energy Industries Association and consulting firm Wood Mackenzie indicates that US solar panel installations by homeowners are expected to fall by 13% in 2024. There are many issues involved: higher interest rates, less generous subsidies to homeowners, not enough grid capacity for new generation, and too much overproduction of electricity by solar panels in the spring and fall, when heating and air conditioning demand is low. The overproduction issue is particularly acute in California.

For each individual 24-hour day, the timing of solar energy production does not match up well with when it is needed. With sufficient batteries, solar electricity produced in the morning can help run air conditioners in the evening. But storage from summer to winter is still not feasible, and batteries for short-term storage are expensive.

[4] It is a myth that wind and solar truly add to electricity supplies for the US and the countries in the EU. Instead, their pricing seems to lead to tighter electricity supplies.

Strangely enough, in the US and the EU, when wind and solar are added to the electric grid, electricity supplies seem to get tighter. For example, one article says, Most of US electric grid faces risk of resource shortfall through 2027, NERC [regulatory group] says.

Charts of electricity supply per capita show an unusual trend when wind and solar are added. Figure 1 shows that, in the US, once wind and solar are added, total electricity generation per capita falls, rather than rises!

Figure 1. US per capita electricity generation based on data of the US Energy Information Administration. (Data is through 2023, even though this is not easy to see from the labels.)

The EU, using a somewhat shorter history period, shows a similar pattern of declining total electricity generation per capita, even when wind and solar are added (Figure 2).

Figure 2. Electricity generation per capita for the European Union based on data of the 2023 Statistical Review of World Energy, prepared by the Energy Institute. Amounts are through 2022.

I believe that the strange pricing systems used for wind and solar in the US and EU are driving out other electricity suppliers, especially nuclear. With this system, intermittent electricity enjoys the subsidy of going first at the regular wholesale market rate. Other providers find themselves with very low or negative wholesale rates in the spring and fall of the year and on weekends and holidays. As a result, their overall return falls too low. Nuclear is particularly affected because it requires a huge, fixed investment, and it cannot be ramped up and down easily.

Besides the foregoing issues affecting the supply of electricity generated, there are also factors affecting the demand for electricity. Electricity generation using wind and solar tends to be high priced when all costs are included. The US and EU are already high-cost areas for businesses to operate. High electricity rates further add to the impetus to move manufacturing and other industry to lower-cost countries if businesses desire to be competitive in the world market.

    On a world basis, in 2022, wind and solar added about 13% to total world electricity generation (Figure 3).


    Figure 3. Electricity generation per capita for the World based on data of the 2023 Statistical Review of World Energy, prepared by the Energy Institute. Amounts are through 2022.

    Based on Figure 3, with the addition of wind and solar, the upward slope of the world per capita electricity generation has been able to remain pretty much constant from 1985 to 2022, at about 1.6% per year. But the US and the EU, as high-cost producers of goods and services, haven’t been able to participate in this per capita growth of electricity.

    Instead, China has been a major beneficiary of the shift of manufacturing overseas from the US and EU. It has been able to rapidly increase its electricity supply per capita, even with wind and solar. It has also been adding both nuclear and coal-fired electricity generation capacity.

    Figure 4. Electricity generation per capita for China based on data of the 2023 Statistical Review of World Energy, prepared by the Energy Institute. Amounts are through 2022.

    Thus, this analysis produces the result a person would expect if the physics of the world economy favors efficient (low-cost) producers.

    [5] It is a myth that the US and EU can greatly ramp up the use of EVs or greatly increase the use of Artificial Intelligence (AI) without relying on fossil fuels.

    Both EV production and AI are heavy users of electricity supply. We have seen that the US and the EU no longer have growing per-capita electricity supplies. Ramping up electricity generation would require a long lead time (10 years or more), a major increase in fossil fuel consumption, and an increase in electricity transmission lines.

    The State of Georgia, in the United States, is already running into this issue, with planned data centers (related to AI) and EV manufacturing plants. The state plans to add new gas-fired electricity generation. It will also import more electricity from Mississippi Power, where the retirement of a coal-fired plant is being delayed to provide the necessary additional electricity. Eventually, more solar panels are planned, as well.

    [6] It is a myth that the world economy can continue as usual, whatever happens to energy supply and growing debt. China’s homebuilding problems could, in theory, lead to debt bubbles crashing around the world.

    The world economy depends upon a growing bubble of debt. It also depends on an ever-increasing supply of goods and services. In fact, the two are closely interrelated. As long as a growing supply of low-priced energy of the types used by built infrastructure is available, the economy tends to sail along.

    China, with problems in its property business, is an example of what can go wrong when energy supplies (coal in China) become expensive, as supply becomes increasingly constrained. Figure 5 shows that China’s per-capita coal supply became constrained in about 2013. China’s per capita coal extraction had been rising, but then it dipped. This made it more difficult for builders to construct the homes planned for would-be homeowners. This is part of what got home builders in China into financial difficulty.

    Figure 5. Per capita coal supply in China based on data of the 2023 Statistical Review of World Energy, prepared by the Energy Institute. Amounts are through 2022.

    Finally, in 2022, China was able to get coal production up. But the way this was done was through very high coal prices (Figure 6). (The prices shown are for Australian coal, but Chinese coal prices seem to be similar.)

    Figure 6. Newcastle Coal (Australia) prices in chart prepared by Trading Economics.

    Building concrete homes at such high coal prices would have resulted in new homes that were far too expensive for most Chinese citizens to afford. If builders were not already in difficulty from low supply, adding high coal prices, as well, would be a second blow. Furthermore, all the workers formerly engaged in home building needed new places to earn a living; the current approach seems to be to move many of these workers to manufacturing, so that the popping of the home building bubble will have less of an impact on the overall economy of China.

    There is now concern that China is ramping up its manufacturing, particularly for exports, at a time when China’s jobs in the property sector are disappearing. The problem, however, is that ramping up exports of manufactured goods creates a new bubble. This huge added supply of manufactured goods can only be sold at low prices. This new low-priced competition seems likely to lead to manufacturers, around the world, obtaining too-low prices for their manufactured products.

    If other economies around the world are forced to compete with even lower-cost goods from China, it could have an adverse impact on manufacturing around the world. With low prices, manufacturers are likely to lay off workers, or give them excessively low wages. If wages and prices are inadequate, debt bubbles in other parts of the world are likely to collapse. This will happen because many borrowers will become unable to repay their debt. This is the reason that we have been hearing a great deal recently about raising tariffs on Chinese exports.

    [7] The world’s biggest myth is that the world economy can continue to grow forever.

    I have pointed out previously that based on physics considerations, economies cannot be expected to be permanent structures. Economies and humans are both self-organizing systems that grow. Humans get their energy from food. Economies are powered by the types of energy products that our built infrastructure uses. Neither can grow forever. Neither can get along without energy products of the right types, in the right quantities.

    We become so accustomed to the narratives we hear that we tend to assume that what we are told must be right. These narratives could be based on wishful thinking, or on inadequate models, or on a sour grapes view that says, “We don’t want fossil fuels anyhow.” We know that humans need food, and that economies will continue to require fossil fuels. We can’t make wind turbines or solar panels without fossil fuels. What do we plan to do for energy without fossil fuels?

    In a finite world, economies cannot continue forever. We don’t know precisely what will go wrong or when it will go wrong, but we can get a hint from the recent failures of myths that our economy may change dramatically in the not-too-distant future.

    Posted in Financial Implications | Tagged , , , | 2,033 Comments

    Advanced Economies Will Be Especially Hurt by Energy Limits

    Historical data show that, to date, a reduction in energy availability has mostly affected the US, European countries, Japan, and other advanced economies. I expect this situation to continue as energy limits become more of a problem. Advanced economies will start looking and acting more like today’s less-advanced economies. The world economy will face a bumpy path in a generally downward direction.

    In this post, I give an overview of our current predicament. All economies are subject to the laws of physics. We are biologically adapted to needing some cooked foods in our diets. We have also moved away from the equatorial regions, so many of us need heat to keep warm. With a world population of 8 billion, we are a long way from meeting all our energy needs with renewable sources alone.

    The world’s fossil fuel supplies are depleting, but politicians cannot tell us the true nature of our predicament. Instead, we are told a “sour grapes” narrative: “We need to move away from fossil fuels to prevent climate change.” What this narrative, in fact, seems to do is shift an ever-greater share of fossil fuels that are available to less-advanced economies. It may also spread out the use of fossil fuels over a somewhat longer period. But there is no evidence that this narrative actually reduces the overall quantity of carbon dioxide emissions. Instead, the more advanced economies are likely to be hit sooner, and harder, than the less advanced economies by the problem of energy limits, pushing them on a bumpy road downward.

    [1] Economies tend to collapse because populations rise faster than the resources (particularly energy resources) required to support those populations.

    We are dealing with an age-old problem: Humans are able to outsmart other animals, and for this reason, human populations tend to rise except when external conditions are quite adverse.

    The necessary steps needed for humans to outsmart other animals began about one million years ago, when pre-humans first learned to control fire. With the controlled use of fire, humans could

    • Cook food to make it easier to chew and digest.
    • Kill pathogens by cooking food or boiling water.
    • Scare away wild animals.
    • Keep warm in colder climates.
    • Eat a more varied diet, with more protein. Primates eat mostly plants; humans are omnivores.
    • Spend less time chewing food and more time working on crafts.
    • Indirectly, the shape of the human body could change. Teeth, jaws, and guts became smaller; brains became larger.

    After 1800, when fossil fuel consumption began to grow, human population started to rise at an unprecedented rate. With coal, it was easier to make metal tools, including cooking utensils, in reasonable abundance. While it is possible to smelt some metals using charcoal (made by partially burning hardwood, then cutting off the air flow), doing so tends to lead to deforestation if more than a small quantity of metal is made.

    Figure 1. World population based on Wikipedia world population data.

    Figure 1 indicates that population had started rising well before 1800. Thomas Malthus wrote about the difficulty of increasing food supply as rapidly as population in 1798. The problem of rising population exceeding resources is an age-old problem.

    [2] The physics reason for the limited lifespan of economies is not understood by many people.

    In many ways, economies are like humans and hurricanes. In physics terms, all three are dissipative structures. They need to “dissipate” energy of the right kinds to remain “alive.” All dissipative structures are temporary in nature. No dissipative structure, including an economy, can stay away from a cold, dead state permanently. Usually, dissipative structures are replaced by slightly different dissipative structures. This process allows long-term adaptation to changing conditions.

    Dissipative structures are self-organizing. They seem to act on their own. Our human leaders may believe they are completely in charge, but this is not really the case. The economy seems to choose its own course, just as humans and hurricanes do.

    The energy products that humans require are food products, some of which need to be cooked. The energy products that economies require are of many kinds, including solar energy to grow crops, human energy to tend the crops, and many types of fuels including firewood, coal, oil, and natural gas. Electricity is a carrier of energy produced by other means. Much modern equipment uses electricity, but trying to transition to an all-electric economy is fraught with peril.

    In today’s world, energy products of many types act to leverage human labor. As far as I can see, growing fossil fuel consumption is the primary reason why human productivity grows.

    Oil is especially important in farming and transportation. Coal and natural gas are important in steel and concrete manufacturing, and in providing heat for many processes. Years ago, oil was burned for electricity, but today coal and natural gas are the fuels typically burned to provide electricity. Fossil fuels are also important for their chemical properties in many different goods, including in plastics, fabrics, drugs, herbicides, and pesticides.

    Using renewable energy, alone, sounds like a good idea, but it is not possible in practice. Forests were the major source of energy to support the economy before the advent for fossil fuels, but deforestation became a problem long before 1800. The world’s population, even at one billion, was too high to sustain using biologically renewable sources alone.

    At a population of around 8 billion today, there is no way that wood, and products derived from wood, can support the energy needs of today’s population. Doing so would be like humans trying to live on a 250 calorie a day diet instead of a 2000 calorie per day diet.

    What are referred to as modern renewables (hydroelectric power and electricity from wind turbines and solar panels) are really extensions of the fossil fuel system. These devices can only be made and repaired using fossil fuels. In addition, today’s electrical transmission system is only possible because of fossil fuels.

    [3] Advanced Economies tend to be “advanced” because of the large amounts of fossil fuels they use to leverage the labor of their citizens.

    In my analysis, I use the term “Advanced Economies” to mean countries that are members of the Organization for Economic Co-operation and Development (OECD). “Other than Advanced Economies” are then equivalent to non-OECD countries. I use this terminology because it better describes the reason why these two groupings have such different indications. Also, it is not intuitive that such a difference underlies these two groupings.

    My analysis shows that energy consumption per capita is much higher in Advanced Economies than in Other than Advanced Economies, for all three energy charts shown: oil (Figure 2), all other kinds of energy grouped together (including renewables) (Figure 3), and electricity (Figure 4).

    Figure 2. World oil consumption per capita, separately for Advanced Economies and Other than Advanced Economies. Chart based on data of the 2023 Statistical Review of World Energy, prepared by the Energy Institute.
    Figure 3. World consumption of energy other than oil per capita, separately for Advanced Economies and Other than Advanced Economies. Chart based on data of the 2023 Statistical Review of World Energy, prepared by the Energy Institute.
    Figure 4. World electricity consumption per capita, separately for Advanced Economies and Other than Advanced Economies. Chart based on data of the 2023 Statistical Review of World Energy, prepared by the Energy Institute.

    It is clear from these charts that the general trend in energy consumption per capita in recent years is down in Advanced Economies, while the general trend in energy consumption per capita is up for Other than Advanced Economies. To me, this means that the self-organizing economic system favors Other than Advanced Economies in the bidding for scarce energy resources.

    One interpretation might be that Advanced Economies are using energy products in a wasteful way, compared to Other than Advanced Economies. The self-organizing world economy in some sense tries to maintain itself, even if some less efficient parts need to be squeezed down or out.

    The narrative we hear from politicians and others is that Advanced Economies are moving away from fossil fuels to prevent climate change. This seems to be the narrative the self-organizing economy provides to people who live in Advanced Economies. I will discuss how this occurs, and its lack of success in reducing overall carbon emissions, in Section [5] of this post.

    [4] Figures 2, 3, and 4 (above) reflect the impacts of several events leading to a squeezing down of energy consumption per capita.

    The following are some events that indirectly squeezed back the energy consumption growth of Advanced Economies:

    • Oil prices spiked in 1973-1974, leading to recession, indirectly in response to US first hitting oil limits in 1970.
    • Severe recession, in response to Paul Volker’s increase in interest rates in the 1977 to 1980 timeframe.
    • China was added to the World Trade Organization (WTO) in December 2001, allowing it to ramp up its manufacturing using coal. This primarily represented an increase in energy consumption by Other than Advanced Economies. At the same time, it removed a great deal of manufacturing from Advanced Economies, so their energy consumption should have been reduced.
    • The Great Recession of 2007-2009.
    • The 2020 pandemic and its response.

    A person can see the impacts that these changes have had on per capita oil consumption (Figure 2), energy other than oil consumption (Figure 3), and electricity consumption (Figure 4), by looking for these dates in the charts, and noticing what changes in trends took place.

    Figure 2 shows that there were very large cutbacks in oil consumption per capita in Advanced Economies, prior to 1983. In this early time frame, cutbacks in oil usage were fairly easy to obtain. Some examples include:

    • US-made cars in the early 1970s were large and fuel inefficient, but Japan and Europe were already making smaller vehicles. By importing smaller vehicles, and making smaller ones in the US, major savings could take place in oil usage.
    • Some oil was being burned to generate electricity. Such generation could be changed to natural gas, coal or nuclear.
    • Home heating often used oil. Such heating could be replaced with heat based on natural gas or electricity.

    With respect to China joining the WTO in 2001, and this action leading to much greater consumption of coal for manufacturing, these actions ironically followed the Kyoto Protocol of 1997. According to this protocol, Advanced Economies indicated that they planned to reduce their own carbon dioxide emissions. They did this by outsourcing manufacturing to countries not affected by the Kyoto Protocol. These countries were poor countries, including China and India.

    It is possible to see the effect of this ramp up in energy consumption by Other than Advanced Economies in both Figures 3 and 4, starting about 2002. In theory, energy consumption per capita by Advanced Economies should have fallen at the same time, but it didn’t. This is one reason why carbon dioxide per capita started rising rapidly in 2002 (Figure 6).

    One squeezing-out event disproportionately affected “Other than Advanced Economies.” This was the collapse of the central government of the Soviet Union in 1991. All the countries involved in the Soviet Bloc were affected. Manufacturing in these countries dropped at about this time, as did all types of energy production and consumption. This can be seen as a small dip in the “Other than Advanced Economies” line between 1991 and 2001 in Figures 2 and 3.

    While the Soviet Union had plenty of fossil fuels, the world oil price was very low (indicating oversupply). As a result, the country was not getting enough revenue for reinvestment in new oil fields and to repay debt and meet other obligations. The world’s self-organizing economy squeezed out the least efficient oil producer, which was the Soviet Union. The fact that the economy was Communist, and thus allocated resources and rewards in a strange way, may have also played a role in the collapse.

    Figure 5 shows the widespread impact of the collapse of the central government of the Soviet Union.

    Figure 5. Chart showing fall in Eastern Europe’s materials consumption, after the collapse of the central government of the Soviet Union in 1991.

    [5] The narrative, “We are moving away from fossil fuels to prevent climate change,” seems to be self-organized by the dissipative structures underlying Advanced Economies.

    The real story is that fossil fuels are moving away from us. Somehow, we must adapt, very quickly, to this disastrous situation. But this is not a story that politicians can tell their constituents, or that universities can tell their students who are studying for future job opportunities. Instead, they need a “best case” scenario: There is perhaps something we can do; we can transition away from fossil fuel use quickly.

    It is not possible to explain to the public what is really happening. Instead, a “Sour Grapes” scenario is presented. In this narrative, the current economy can continue, much as today, without fossil fuels. (This is clearly nonsense in a physics-based economy, with today’s “renewables.”) We should move away from fossil fuels because they add too much carbon dioxide to the atmosphere.

    It should be noted that this “we-can-move-from-fuels narrative” has been spearheaded by the International Energy Association (IEA), which is an arm of the OECD. (I mentioned earlier that I have equated OECD with Advanced Economies). Countries included in “Other than Advanced Economies,” at best, claim lip service to limiting carbon emissions. Their primary interest is in raising the living standards of their populations. To a significant extent, the fossil fuels that Advanced Economies decide not to use can be used by Other than Advanced Economies.

    Figure 6 below shows that the efforts of IEA/OECD to reduce carbon dioxide emissions have worked in precisely the wrong direction, on a world basis. Preliminary data for 2023 shows that world carbon dioxide emissions from fossil fuels rose by another 1.1%.

    Figure 6. Carbon dioxide emissions from energy utilization, based on data of the 2023 Statistical Review of World Energy, prepared by the Energy Institute.

    The plan to reduce carbon emissions for participating countries was first specified in the Kyoto Protocol of 1997. The World Trade Organization (WTO) began a little earlier than this, in 1995. The purpose of the WTO was to increase world trade and thus the total goods and services the world economy was able to produce. In some sense, the Kyoto Protocol and the WTO had opposite objectives. The only way more goods and services could be produced was by using more fossil fuels.

    Figure 6 shows that fossil fuel emissions increased sharply after China joined the WTO in December 2001. China was able to ramp up its industrial production using its very large coal resources. It is not clear that the Kyoto Protocol did much besides encouraging Advanced Economies to move their manufacturing elsewhere. This paved the way for the industrialization of Other than Advanced Economies, mainly by burning coal. At the same time, the Advanced Economies have been turned into service economies that are dependent upon Other than Advanced Economies for manufactured goods of nearly all kinds.

    NASA says that when carbon dioxide is added to the atmosphere, it stays around for 300 to 1000 years. NASA also reports that the increase in atmospheric CO2 at Mauna Loa was the highest ever in 2023.

    Figure 7. Figure showing annual increases in carbon dioxide emissions at Mauna Loa observatory, prepared by NASA. The black lines represent 10-year averages.

    The increases shown on Figure 7 are relative to a large base. As percentages, they range from about 0.2% per year in the earliest periods to about 0.6% per year in recent periods.

    In summary, whatever the Advanced Economies are doing to restrict emissions still leaves the world’s emissions from fossil fuels, as well as atmospheric emissions, rising fairly rapidly. Given the self-organizing nature of the world economy, I am doubtful that there is anything we humans can do to fix this situations. The people in Other than Advanced Economies need fossil fuels to feed their growing populations, and to give them the basic necessities of life.

    [6] Figure 8 shows the path that Advanced Economies seem to be following.

    In my opinion, with less oil and other energy per capita, Advanced Economies have become increasingly hollowed out, with more of their manufacturing transferred to Other than Advanced Economies.

    Figure 8. Chart prepared by Gail Tverberg showing some of the dynamics of today’s Advanced Economies hitting per-capita resource limits.

    In Figure 8, economies start out small, with growing resources per capita. As resource limits are hit, economic growth slows, and well-paying jobs become harder to get, especially for young people. In agricultural economies, the problem is that farms need to get smaller and smaller if there are too many surviving children, and they all want to be farmers. Clearly, too small a farm will not feed a growing family.

    In the case of Advanced Economies, they become hollowed out because they find themselves increasingly dependent on imported goods and services. Other than Advanced Economies, with lower wages, less overhead for heating/cooling homes and health care, and lower energy costs, can produce manufactured goods more cheaply than Advanced Economies.

    As Advanced Economies lose manufacturing and industries such as mining, they also become more dependent on debt and government programs. This added debt becomes increasingly hard to service, especially when interest rates rise.

    Advanced Economies become particularly vulnerable to adverse changes because they have lost the ability to manufacture many of the goods required for everyday living. In fact, it becomes a problem even to fight wars, because many of the materials required to make weapons need to be imported from overseas.

    Over the long-term, collapse may occur, but this collapse is unlikely to occur all at once. Instead, it can be expected to be what is sometimes called catabolic collapse, which takes place in steps. Parts of the economy will hold together as long as there are resources to support those parts. Future changes in Advanced Economies can be thought of as being somewhat like the changes to the economy in 2020 (indirectly related to Covid-19), but “on steroids.”

    [7] Some of the kinds of changes that can be expected.

    We don’t know precisely what changes to economies lie ahead, but these are some ideas of things might happen to Advanced Economies before a full collapse.

    [a] Loss of the “hegemony” of the US. In the years since World War II, the US has taken on the role of the world’s policeman. But the US has been having increased difficulties when it comes to actually winning the wars it gets involved in. It is very difficult for the US to make weapons in quantity when large parts of the supply lines involve other countries. Also, today’s weapons aren’t necessarily suited to dealing with today’s attacks, such as by the Houthi Group in the Red Sea.

    Changes may already be starting. We hear about Victoria Nuland’s recent abrupt retirement as Under Secretary of State for Political Affairs. She is described as “a determined advocate of tough policies toward Vladimir Putin.” She is being replaced, at least temporarily, by John Bass, who oversaw the US withdrawal from Afghanistan.

    [b] Loss of the US dollar as the world’s reserve currency. The US has had a financial advantage, as long as all other countries had to first change their currencies to the US dollar, in order to trade among themselves. This arrangement allowed the US to import more than it exported, year after year. It also allowed the US to use sanctions against other countries to cut off their trading abilities.

    Changes already seem to be starting to reduce the role of the US dollar as the world’s reserve currency. In May 2023, Reuters reported, Vast China-Russia resources trade shifts to yuan from dollars in Ukraine fallout. Also, the BRICS nations have been working on an alternative currency, as a possible replacement currency for trading. And, of course, there are all kinds of cryptocurrencies that might be expected to facilitate purchases across borders.

    [c] Major loss of trans-Atlantic and trans-Pacific freight trade and passenger travel. An easy way to save oil would be to stop shipping goods as far as producers do today. Unfortunately, quite a bit of what we purchase in the US has supply lines that start in China.

    Without trans-Atlantic or trans-Pacific supply lines, many goods the US depends upon would disappear from shelves in the US. Computers and telephones, for example, might become unavailable, as would many drugs, especially low-cost drugs. Even high-quality steel drilling pipes, used for oil extraction, might become difficult to obtain.

    It is not clear how the US would deal with this issue. It is likely that the economy would need to find substitutes or get along without whatever is lost due to broken supply lines.

    [d] Significant defaults on financial promises of all kinds, including bonds, loans made by banks, rental contracts, and derivatives. Ultimately, a decline in asset prices seems likely.

    The amount of debt and financial products used in Advanced Economies is at record levels. If a major recession occurs, debt defaults and derivative failures can be expected. Some renters will default on their contracts. Bank failures can be expected, as well.

    Politicians will not want to throw people out of their homes; they likely won’t even want to take their automobiles away. Instead, it is likely to be those who are counting on wealth from long-term promises made by poor people who lose out. For example, some of today’s wealthy people may find their wealth disappears when renters cannot make payments on their apartments or farms.

    If bank lending starts becoming a problem, peer-to-peer lending may start to take a larger role. This would seem to be the equivalent of replacing taxis by Ubers and replacing hotels by private citizens renting out rooms. The total amount of debt available will fall. With less debt available, asset prices of all kinds will tend to fall.

    [e] Much more interest in reusing old buildings, old furnishings, and old clothes. Also, making use of salvaged parts of buildings and spare parts from old mechanical equipment, including automobiles.

    If the making of goods that depend on overseas supply lines becomes difficult, substitutes such as previously used goods will likely be in demand. For example, we may go back to sourcing replacement parts from automobiles parked in junk yards.

    Local entrepreneurs will find ways to make use of whatever goods can be used again. Such work may be a new source of jobs.

    [8] We are likely to have a bumpy road ahead. Energy and the economy work together in very strange ways. While the path is generally downward for the world, the part of the world that uses energy very sparingly has a better chance of maintaining and even increasing its standard of living.

    Our self-organizing economy puts together all kinds of narratives that lead us to believe that we certainly know the only path forward (and, in fact, we can control the economy to follow this path). But the system doesn’t behave the way we think it does. We assume that if we in the United States or Europe stop using fossil fuels, it will reduce the world’s use of fossil fuels. For example, stopping the Keystone XL Pipeline in 2021 was considered a great environmental victory. But now we read, Canada could lead the world in oil production growth in 2024.

    This extra production will likely be going west to China and to other Asian destinations. Canada’s expanded Trans Mountain Pipeline will open in April 2024, adding 590,000 barrels per day of export capacity. If US protestors don’t want Canada’s “tar sands,” many people in China and other poor countries certainly want it. The very heavy oil that Canada produces is ideal for producing diesel, which the world economy is short of.

    Likewise, the US may have bypassed easily mineable coal in its rush to shift electricity generation to natural gas. If the US cannot maintain its military strength, this coal becomes a valuable resource for any military power that wants to test its strength against the US. This available coal makes war against the US by other powers more likely. It is well known that a major reason for wars is to obtain energy resources for one’s own people.

    We don’t know what is ahead. The “truths” that we are sure we know, aren’t necessarily true. The world economy seems likely to head downward slowly, but this general downward movement will be in spurts. Trying to predict exactly what is ahead is close to impossible.

    Posted in Energy policy, Financial Implications, Introductory Post | Tagged , , , | 2,175 Comments

    Should the US add more LNG export approvals?

    In the US, companies that want to build liquefied natural gas (LNG) export terminals need to get advance approval for their plans from the US Department of Energy. There was a recent news item saying, “Biden pauses LNG export approvals under pressure from climate activists.” After looking into the situation, I 100% agree with Biden’s decision. There is no sense in the US adding more approvals for added LNG capacity at this time. This is the case, completely apart from climate considerations.

    When looking into the situation, I found that the US already has a huge amount of LNG export capacity approved but not yet under construction. The likely roadblock is the need for debt financing. One obstacle is the need to find investors willing to make very long commitments–as long as 25 years, considering the time to build the LNG plants, plus the time that they are expected to be in operation. Issues that could be expected to get in the way of long-term investment would include:

    • Today’s relatively high interest rates.
    • Today’s low US natural gas prices (Henry Hub natural gas price is currently $1.64 per million Btus, a near-record low), discouraging investment in natural gas extraction.
    • The possibility that US oil and natural gas extraction from shale formations will reach limits within the next 25 years.
    • The possibility that overseas buyers will not be able to afford exported LNG at the prices needed to make extraction profitable. For example, a selling price of $25 per million Btus would probably greatly reduce the quantity of LNG that could be sold in the EU.
    • The possibility of construction delays caused by broken supply lines.
    • The possibility of fires causing significant down-time in operating facilities.
    • Even if natural gas is available for export, and even ifā€‚LNG export facilities are built, there is the possibility that the rest of the system, including specialized LNG transport ships, may not be available in sufficient quantities.

    In this post, I will try to give some background on this issue.

    [1] Many people seem to believe that the US can easily ramp up natural gas production for export if it chooses to do so.

    There seems to be a common belief that the US has an almost unlimited supply of oil. Natural gas is produced together with oil, so a corollary to the high supply of oil is that the US has an almost unlimited supply of natural gas.

    At the same time, there are many parts of the world with an inadequate supply of natural gas. Many of these countries are trying to add wind and solar power generation. Natural gas is very helpful for balancing wind and solar because electricity production from natural gas can be ramped up and down very quickly, filling in when intermittent sources of supply are not available.

    The European Union (EU) is one area that has very inadequate natural gas supply (Figure 1). The EU is also known for its use of wind and solar power, so it needs natural gas for its balancing ability.

    Figure 1. European Union natural gas production divided between natural gas extracted within the European Union and that imported from elsewhere, either by pipeline or as LNG. Based on data from the 2023 Statistical Review of World Energy, produced by the Energy Institute.

    If it is true that the US has a huge supply of US natural gas, all that would seem to be needed to solve the EU’s wind and solar balancing problem is for the US to export natural gas to the EU.

    The modern way of exporting natural gas seems to be as LNG, transported by specialized ships at a very low temperature (about – 260Ā°F (-161.5Ā°C)). It appears that all that the US needs to do is to ramp up its natural gas production, and with it, its LNG export infrastructure.

    [2] Natural gas prices vary widely around the world. US prices are much lower than elsewhere. These differences would also seem to support building more LNG export facilities.

    Figure 2ā€‚shows that US natural gas prices are much lower than elsewhere. This has especially been the case since 2008 when the shale boom began, making it look as if the US can easily export natural gas if it likes. Even with the cost of shipping included, it looks as if consumers in the EU and Japan might find US LNG attractive in price.

    Figure 2. Average annual natural gas prices, adjusted to 2020 price levels, based on data from the 2023 Statistical Review of World Energy by the Energy Institute. For the EU, the average of two price levels is used: German Average Import Price and Netherlands TTF. For Japan, the average of Japan CIF and Japan Korea Marker prices is used. US Henry Hub is directly from the report. All are converted to 2022 levels using the same inflation adjustment factors as used for oil prices.

    [3] Natural gas tends to be cheap to extract but getting it to the customer and storing it until the right time of year is an expensive headache.

    Natural gas is a fuel that is disproportionately used in winter to heat homes and businesses. This heat can be provided by burning the natural gas directly, or it can be provided by first burning the natural gas to produce electricity, and then using a device, such as a heat pump, to provide heat.

    If natural gas can be utilized close to where it is extracted, there tends to be a huge cost advantage over long-distance transport. Clearly, one reason is that utilization near the point of extraction reduces transit costs. Also, empty gas caverns that can be used for storage are often available near the point of extraction. This storage approach is much less expensive than building specialized tanks for storage. These cost advantages are one reason why US natural gas prices shown on Figure 2 are much lower than those in the EU and Japan.

    [4] Low natural gas prices in the US are now well “baked into the system.”

    With natural gas prices remaining low for around the past 16 years, individuals and businesses have adjusted their consumption patterns based on the assumption that an abundant supply of inexpensive natural gas will be available permanently. US natural gas production has approximately doubled since its low point in 2005, and consumption has almost kept up.

    Figure 3. US natural gas production and consumption, based on data from the 2023 Statistical Review of World Energy by the Energy Institute.

    Many changes have taken place since gas prices fell. The US electrical system has significantly reduced its reliance on coal and instead increased its utilization of natural gas. People have built oversized homes based on the assumption that cheap natural gas will be available to heat them. Businesses have built factories in the US under the assumption that electricity costs of the US will continue to be low compared to those in Europe, Japan, and many other parts of the world, indirectly because of the US’s inexpensive supply of natural gas.

    These low electricity and natural gas prices give the US a competitive advantage in making goods for export. With the shift away from coal for electricity production, the US can now say that it has reduced the carbon intensity of its electricity. Politicians like the competitive advantage for the US as well as the lower carbon intensity. Few of them would vote to go back to earlier ways, even if it was possible to do so.

    [5] Natural gas tends to be utilized close to where it is produced. The early form of natural gas export was by pipeline. In recent years, LNG exports have increased.

    Figure 4. World natural gas consumption by extent of inter-regional trade based on data from the 2023 Statistical Review of World Energy by the Energy Institute. In this analysis, Europe is a separate region, as are the United States and Russia.

    Figure 4 shows that, consistently, about 75% of natural gas is used in the region where it is extracted. This happens because natural gas tends to be inexpensive close to the point of extraction. The use of inexpensive resources helps make an economy competitive in the world market, making them attractive for local use.

    Pipeline trade tends to be inexpensive if the distance is short. The disadvantage is that pipeline gas tends to be inflexible; prices are often locked in for long periods. Pipelines can be a disadvantage if they pass through another county. The country allowing transit will likely want to make a charge for this service; this can lead to conflict. Pipelines can easily be blown up if countries start fighting with each other.

    LNG is the newer approach to exporting natural gas. Its advantage is its flexibility; its disadvantage tends to be its higher cost when the entire cost of the operation is considered. There need to be export facilities where the natural gas is chilled and loaded into specialized tankers. Investors, quite possibly from another country, need to invest in the specialized tankers used to transport the LNG. At the other end, there is the need for regasification plants and for gas pipelines to the facilities where the gas is to be utilized.

    Recouping the total cost of the system can be a problem with LNG. If prices are set under long-term contracts pegged to the price of oil, as has been the case between Japan and Russia, advantageous prices for the producers can be obtained. (Note the high prices Japan has been paying in Figure 2.) Of course, with long-term contracts, the flexibility of the system is lost.

    In some years, there has been more LNG capacity than required in Europe. Exporters without long-term contracts started selling natural gas at spot prices, depending upon the balance between supply and demand at the time of the sale. (Notice the lower natural gas prices for Europe in Figure 2). It is not clear to me that investors can earn enough on their investments, if they are forced to depend on spot prices, which can easily fall too low if there is excess supply.

    On the other hand, if the LNG market gets tight, as it did in 2022, spot prices can jump very high, making it difficult for LNG buyers to find affordable supply.

    [6] An analysis by the EIA indicates that the US already has a great deal of LNG export capacity at some stage of development.

    The most recent EIA analysis of LNG capacity in the process of being developed is shown at this link.

    Figure 5. Chart prepared in March 2023 by the EIA showing forecasts of LNG exports, under several scenarios.

    The above analysis was performed using data as of the end of 2022. It shows that at that time, the amount of liquefaction capacity was

    • 37.0 billion cubic feet/day (Bcf/d), considering existing, under-construction and approved liquefaction capacity.
    • 18.7 Bcf/d, considering existing and under-construction liquefaction capacity.

    More recent information is also available.ā€‚A release dated January 26, 2024, by the Department of Energy says,

    The United States is the global leader in LNG exports with 14 billion cubic feet per day (Bcf/d) in current operating capacity and 48 Bcf/d in total authorizations approved by DOE to date, over three times our current export capacity.

    This quote seems to imply that the total authorizations increased from 37.0 Bcf/d to 48 Bcf/d, based on an unpublished, more recent, analysis.

    The 14 Bcf/d in current operating capacity is far above recent LNG export amounts. The actual quantity of US LNG produced in 2022 was 10.8 Bcf/d based on the data underlying Figure 5. Based on data through November 2023, I would estimate that amount of LNG produced in 2023 amounted to about 11.7 Bcf/d. These comparisons suggest that the actual amount of LNG produced may lag significantly below the stated export capacity.

    If we compare the total exports authorized of 48 Bcf/d to the actual production amount (about 11.7 Bcf/d for 2023), the ratio is over 4, implying a very high amount of authorized additional LNG production capacity.

    [7] The EIA model shown in Figure 5 indicates that several conditions need to hold for LNG exports to ramp up substantially.

    (a) Figure 5 indicates that for NGL exports to increase significantly, both oil and natural gas prices need to be high. With low oil and low natural gas prices, exports do not increase much at all, regardless of the infrastructure built. (As I noted in the introduction, US natural gas prices are now very low. World oil prices are not very high, either. Thus, the model indicates that not much ramping up in NGL exports should be expected, even if more export capacity is added.)

    (b) To enable export of the maximum amount of LNG overseas, “Fast Builds” of the rest of the infrastructure also needs to be high. In other words, there must be rapid growth in the number of LNG transport carriers and in receiving facilities for the exported LNG.

    (c) The fact that the gray shaded area (indicating the scenarios the modelers thought likely) does not extend to the Fast Builds scenario means that the modelers consider this scenario unlikely. Even if infrastructure is built on this end, other parts of the system likely won’t be in place.

    (d) Hidden in the assumptions is the fact that the citizens at the receiving end of the LNG must be able to afford electricity made with high-priced natural gas and products such as fertilizer, made with high-priced natural gas. If citizens at the receiving end cut way back on their use of natural gas (by not heating their homes as much, or by doing less manufacturing using electricity, or by making less fertilizer with natural gas), export prices are likely to fall.

    [8] The reason why oil prices need to be high for high LNG exports is because much of the natural gas extracted is produced at the same time as oil.

    If oil prices fall too low, US production of oil from shale is likely to drop (as it did in 2020), and with it the production of natural gas. With low oil prices, US natural gas extraction is also likely to lag. In this scenario, the natural gas necessary to support the hoped-for rise in natural gas exports won’t be available.

    With both high oil prices and high US natural gas prices, consumers in the EU and elsewhere will have an especially difficult time affording the high cost of imported natural gas from the US. The problem is that if natural gas costs are already high before all of the cost of processing it to make LNG and shipping it long distance are incorporated, its cost will be doubly high for buyers in the EU (and elsewhere). Furthermore, the budgets of EU consumers will already be stretched by high oil prices, making high-cost LNG even more unaffordable.

    [9] People believe that fossil fuels can rise arbitrarily high, but this is not true. Unaffordably high prices are the limiting factor for LNG exports.

    Farmers are particularly strongly impacted by high oil and natural gas prices. High oil prices tend to make the cost of the diesel used to run farm equipment very high. High natural gas prices tend to make ammonia fertilizer very expensive. If both oil and natural gas prices are very high, the combination will tend to lead to very high-cost food. Citizens generally get very unhappy about very high-cost food. Farmers tend to protest, as farmers in Europe have done recently, because it becomes impossible for them to pass their high costs on to consumers.

    There are clearly many other parts of the economy affected by high oil and natural gas prices. With high natural gas prices, electricity prices tend to be high. Families find their budgets stretched because of the high cost of both home heating and transportation. Food costs are likely to be high also. Economies tend to be pushed into recession by high oil and natural gas prices.

    [10] A wise approach would be to go slowly in building LNG export capacity.

    If excess LNG export capacity is built, those building the liquefaction plants will find the return on their investment very low.

    In a self-organizing system, new technology is usually slowly adopted. Investors see a niche that appears to be profitable and build a little at a time. They wouldn’t try to put a huge amount of LNG export capacity in place without making certain that a little bit works. This same approach is used by manufacturers trying any new technology; they start on a small scale and then gradually scale up the process.

    The US has already approved a very substantial amount of future LNG liquefaction capacity. It seems to me that there is a need to pause the acceptance of new applications for a while to see whether the many LNG facilities in the queue can actually be built and can sell the LNG they produce profitably. Perhaps profitable new LNG plants can only be built if firm long-term contracts at quite high prices can be signed.

    Going slowly would seem to be an appropriate approach for now.

    Posted in Financial Implications | Tagged , , | 2,426 Comments

    2024: Too Many Things Going Wrong

    It will be an interesting year.

    We know that the age of peak performance for humans varies, depending upon the activity. Peak performance for an athlete tends to come between ages 20 and 30, while peak performance for a person writing academic papers seems to come betweenĀ ages 40 and 50 years. By the time people are 80 years old, they have a strong suspicion that health and other aspects of performance will deteriorate in the next 20 years.

    Economies, in physics terms, are similar to human beings. Both are dissipative structures. They require energy of the appropriate kinds to keep their systems growing and operating normally. For humans, the main source of this energy is food. For an economy, it is a mixture of energy that the economy is specifically adapted to. Todayā€™s economy requires a certain mixture of energy directly from the sun, plus energy from fossil fuels, burned biomass, and nuclear energy. Electricity is a carrier of energy from different sources. It needs to be available at the right time of day and the right time of year to allow todayā€™s economy to continue.

    Most people donā€™t realize that economies grow and eventually collapse. For example, we know that the Roman Empire started its growth in 625 BCE and reached its peak extent in 211 CE. It declined somewhat between 211 CE and 456 CE, when it finally collapsed after several invasions. The growth and collapse of economies is very much expected because of their nature as dissipative structures.

    In 2024, the world economy is acting more and more like an 80-year-old man than like a young vigorous economy. Perhaps the economy can continue for quite a few more years, but it increasingly looks like it is in danger of falling apart, or of succumbing as a result of what might be regarded as minor problems.

    Trying to predict precisely what will happen in the year 2024 is difficult, but in this post, I will examine some of the things that are going wrong in this increasingly creaky old economy.

    [1] Too many parts of the world economy are changing from growth to shrinkage.

    The blue circles can illustrate many different things:

    • The total goods and services produced by the economy;
    • The quantity of energy required to produce the total goods and service produced by the economy;
    • The total population that is supported by these goods and services (which will generally be rising or falling, too);
    • Goods and services per person (which tend to rise during periods of growth and fall in a shrinking economy);
    • And, strangely enough, the ability of the economy to maintain complexity. Without enough energy, structures such as governments tend to fail.

    As the economy moves away from growth, toward shrinkage, major changes can be expected.

    [2] In a growing economy, repaying debt with interest is very easy. In a shrinking economy, repaying debt with interest becomes close to impossible.

    If an economy is growing, there will likely be an increasing number of jobs available over time, and they will pay relatively more. If a person loses his/her job, it is not very difficult to get a position that will pay as much or more. Paying back a loan on a house or an automobile tends to be easy.

    A corresponding situation occurs for businesses. If the business can count on an increasing number of customers, overhead becomes easier and easier to cover with a growing consumer base.

    The reverse is obviously true in a shrinking economy. Jobs may be available if a person loses his/her current job, but the jobs donā€™t pay very well. Businesses may face periods with suddenly lower demand, as in 2020. There is a sudden need to reduce overhead, such as payments for office space, if the space is no longer being utilized by employees.

    Clearly, if interest rates rise, it becomes increasingly difficult for borrowers of all kinds to repay debt with interest. Raising interest rates is thus a way to intentionally slow the economy. If the economy is growing too quickly (like a 20-year-old sprinter), then such a change makes sense. But if the economy is behaving like an 80-year-old, hobbling along on a walking stick, it becomes likely the economy will figuratively fall and become severely injured. This is the danger of raising interest rates when the world economy is having difficulty growing at an adequate rate.

    [3] The physics of the system dictates that as the system shifts in the direction of shrinkage, the wealth of the system is increasingly distributed toward the rich and very powerful, and away from those of modest means.

    Physicist Francois Roddier writes about this issue in his book, The Thermodynamics of Evolution. He likens energy (and the goods and services produced using this energy) as being like energy applied to water. When energy levels are low, the less wealthy members of the economy tend to be squeezed out, just as (low energy) frozen water turns to ice. The reduced amount of energy available (and goods and services produced using this energy) increasingly bubbles up to the small number of economic participants at the top of the economic hierarchy. This issue tends to make the already rich even richer.

    In some sense, the self-organizing economy seems to preserve as much of the economy as it can, when energy supplies are inadequate. The wealthy seem to be important for keeping the whole system operating, so the physics tends to favor them.

    Inflation, in general, is a problem, especially for people with limited income. Higher interest rates also take a big ā€œbiteā€ out of spendable income. This problem is greatest for low income people. The benefit of higher interest rates, and of capital gains, tends to go to high income people. 

    High food prices especially affect the poor because, even in good times, food tends to be a high share of their income. For example, in a poor country, if food costs amount to 50% of a personā€™s income when food prices are moderate, a 20% increase in food prices will lead to food prices costing 60% of income. Such a situation quickly becomes intolerable because there is not enough income left for other essential goods. 

    Figure 2. Chart by the Federal Reserve of St. Louis showing the Share of the Total Net Worth Held by the Top 1% of US Citizens (99th to 100th percentile).

    The figure above shows that between 1990 and 2022, the share of total wealth held by the top 1% of US citizens rose from 23% to 32%. This means that other citizens were increasingly squeezed out of the benefits of the growing economy.

    [4] With their newfound power (arising from the growing concentration of wealth), the wealthy are tempted to exert increasing control over the economic system.

    The fact that the world economy was likely to reach annual limits of fossil fuel extraction about now has been known for a very long time. I have referred to a 1957 speech by US Navy Admiral Hyman Rickover pointing out this bottleneck many times. Wealthy individuals have known about this bottleneck for a very long time. They have been asking themselves, ā€œHow can we increasingly benefit from this change?ā€

    Clearly, reducing the population growth rate has been one of the goals of some of these wealthy individuals. With fewer people to share the resources available, everyone will benefit.

    But the wealthy can also see that hiding the energy bottleneck would be of huge benefit in keeping the current system operating as usual. These individuals, through the World Economic Forum and other organizations, have pushed for zero global warming emissions. They have tried to reframe the problem of inadequate inexpensive-to-produce fossil fuels as a problem of too large a quantity of fossil fuels for the system to handle. In their view, we can decide to transition away from fossil fuels without significantly adverse impacts.

    By hiding the energy bottleneck, companies selling vehicles can claim they will be useful for many years. Educational systems can claim that we are well on our way to finding substitutes for fossil fuels, and that there will be good jobs available in the new systems. With the bottleneck problem hidden, politicians do not have to present citizens with a very concerning and intractable issue. Since a happily-ever-after narrative is desired by all, it is easy for the wealthy (and politicians who want to be reelected) to influence the major news outlets to present only this view to readers. 

    [5] Major cracks in the economy are likely to start showing soon. The energy bottleneck is already pulling the economy down, even if major news media are reluctant to discuss the problem.

    The problem displays itself in several different ways:

    (a) The economy has moved toward two widely differing views regarding todayā€™s energy situation.

    The narrative presented in the press is that we have an excessive amount of fossil fuels. In this view, any shortage of fossil fuels (or any other resource) would be quickly accompanied by rising prices. These rising prices would allow an increasing quantity of these materials to be extracted, quickly solving the problem. But the real story, for anyone who examines the details, is quite different. Affordability becomes very important, holding prices down. History shows that nearly every civilization has collapsed. Populations tend to grow but the resources supporting the economies donā€™t grow quickly enough. Rising prices donā€™t fix the problem!

    People who work with fossil fuels know how essential they are for our current civilization. The story about intermittent wind and solar substituting for fossil fuels sounds very far-fetched if a person thinks about the need for heat in the winter and the difficulties associated with long-term storage of electricity. The two widely differing narratives surrounding our energy future sound like they could have come from the dystopian novel Nineteen Eighty-Four by George Orwell.

    (b) Repaying debt with interest gets to be an increasing problem.

    Strange as it may seem, added debt can temporarily act as a placeholder for additional energy. Debt is a promise for goods and services that will be made with future energy. This placeholder can allow capital goods, such as factories, to be made which allow more goods and services to be made in the future. This placeholder can also be used as the basis for money to pay workers, so that they can afford to purchase more goods.

    At some point, the debt becomes too much for the system to sustain. We are seeing some of this in China, where there have been debt defaults in the real estate market. In the US, the commercial real estate market is experiencing high vacancy rates. There is increasing concern that, in many places, commercial real estate can only be sold at a huge loss. In this situation, the holders of debt are likely to sustain massive losses.

    (c) Political parties start differing widely on whether to increase government debt. 

    The more conservative parties do not want to keep adding more debt, but the more liberal parties insist that there is no other way out: If there isnā€™t enough energy of the right kind, the added debt can perhaps be used to fund projects in the renewable energy sector that will create the illusion of progress toward an adequate supply of energy of the right kind at the right price. The added debt can also be used to continue the many social programs promised to citizens and to provide support for activities such as the war in Ukraine.

    So far, adding debt has worked for the US because the US dollar is the worldā€™s reserve currency and because the US has tended to keep its target interest rates high, encouraging other countries to invest in US securities. If other countries try to add substantially more debt, their currencies will tend to fall, leading to inflation. 

    The US may soon also run into an inflation problem because of added debt. This happens because it is possible to ā€œprint money,ā€ but it is not possible to print goods and services made with inexpensive energy products. For example, the temptation is to bail out failing banks and pension plans with added debt. To the extent that this debt gets back into the money supply, but there arenā€™t added goods to match, the result is likely to be inflation in the prices of the goods and services that are available.

    (d) Broken supply lines are another sign of an economy reaching limits.

    When there arenā€™t quite enough goods and services to go around, some would-be buyers of goods have to be left out. 

    In the last three years, all of us have experienced at least some problems with empty shelves in stores and the unavailability of needed parts for repairs. Many kinds of drugs are in short supply around the world. Heavy industry has been encountering problems, as well. In 2022, Upstream Online wrote, ā€œDrill pipe shortages causing headaches for US producers [of oil and natural gas].ā€ 

    If we are reaching the limit of inexpensive fossil fuel available for extraction, an increasing number of these problems can be expected. These supply line problems tend to raise costs in a different way than ā€œregularā€ inflation. Often, a more expensive product must be substituted, or a higher cost workaround is needed. For example, a person may need to use a rental vehicle while his current vehicle is being repaired because of unavailable replacement parts. 

    (e) Conflicts arise when there are not enough goods and services to go around.

    Part of the conflict comes from wage and wealth disparity. For example, an increasing number of people are finding reasonably-priced housing impossible to find. The combination of high interest rates and high housing prices tends to make home-buying a luxury, available only to the rich. An increasing share of young people are also finding automobiles too expensive to afford. One way ā€œnot-enough-goods-and-services-to-go-aroundā€ manifests itself is by many people not being able to afford the products in question. 

    There is often a belief that a more equitable distribution of income would solve the problem. But, if the economy cannot build more cars or homes because of energy shortages, this doesnā€™t fix the problem. Providing more money to the poor would instead cause inflation in the price of the goods that are available.

    Another way this conflict manifests itself is in conflicts among countries. Countries selling fossil fuels, such as Russia, would like higher fossil fuel prices, so that the standards of living of their own people can be higher. However, if fossil-fuel-importing countries, such as those in Europe, are forced to pay higher prices for the fossil fuel they use, it becomes difficult for companies in these countries to manufacture goods profitably. Also, the higher fossil fuel prices make the cost of growing food higher. Customers often cannot afford higher food prices.

    In the case of the fight between Israel and Gaza, at least part of the conflict relates to the natural gas field that Israel is developing, but which arguably belongs to Gaza. If Israel can develop this resource, it may be able to keep its own economy expanding for a while longer. The people of Gaza will remain very poor.

    (f) Manufacturing around the world seems to be reducing in quantity. It definitely is not rising to keep up with population growth.

    The big shortfall today is in goods, rather than in services. This is what a person would expect if an energy problem is giving rise to the problems we are currently experiencing.

    The organization S&P Global Market Intelligence puts out an index called the Purchasing Managers Index, for 15 countries, including a global average. The manufacturing portion of this index is in contraction on a worldwide basis, as of the latest data available. The extent of this manufacturing contraction is especially significant for the US, the European countries included, for Japan, and for Australia. The countries that are not in contraction are India, Russia, and China. 

    If manufacturing is in contraction, we would expect more broken supply lines in the months and years ahead.

    [6] How will all this turn out, in 2024 and long term?

    I donā€™t think we know. Things are likely to get worse economically, but we donā€™t know how much worse. We know that an elderly person can easily succumb to some illness. In the same way, we know that if the economy has enough weak points, a major collapse might occur, even without a huge decline in energy availability.

    At the same time, the economy seems to have a lot of resilience. Leaders of the US, and perhaps of other countries, as well, seem likely to take the route of adding increasing amounts of debt, to bail themselves out of whatever problems arise. If banks get into trouble, some new funding facility will be developed. If Social Security or private pensions need more funding, it will likely be provided by more government debt. This leads me to suspect that in the US, at least, there is likely to be a higher risk of hyperinflation (lots of money but very little to buy) rather than deflation (very little money, but also very little to buy).

    The Universe came into being, apparently out of nothing. The Universe has grown and continues to grow. Eric Chaisson, in his 2001 book, Cosmic Evolution: The Rise of Complexity in Nature, shows that the trend in the Universe has been toward ever greater complexity. 

    Figure 3. Image similar to ones shown in Eric Chaisson’s 2001 book, Cosmic Evolution: The Rise of Complexity in Nature.

    Together, it appears that the Universe, itself, acts like a dissipative structure. Self-organization leads the Universe to grow and become more complex, as long as it has adequate energy. The question becomes, ā€œWhere is the expanding energy supply for the Universe as a whole coming from? Can the expanding energy supply continue indefinitely, or until whatever force started it, chooses to stop it?ā€

    It seems to me that there is something from outside pushing the whole Universe along. Economists talk about ā€œan invisible hand.ā€ People from a religious background might say that there is a God who created the Universe, and is continuing to create it every day, through involvement in the things that take place on Earth, including the strange happenings in 2020. 

    If I am correct that there is an outside force influencing the economy today, perhaps Earthā€™s problems are temporary. One possibility is that eventually a new type of energy solution will be found. There is also the possibility that, at some point, whatever force started the Universe may cause the operation of the Universe to cease. A replacement (which we can think of as heaven) might be provided instead. 

    The popular narrative tends to see ourselves as having a great deal of power to manage problems with our current economy, but I donā€™t think that we have very much power to influence the system we find ourselves embedded in. The economic system behaves on its own, based on market forces, just a child grows up, matures, and eventually dies. The system within which we live is very much guided by what we call self-organization, which is outside our power to control.

    Posted in Financial Implications, Introductory Post | Tagged , , , | 2,922 Comments