Energy limits are forcing the economy to contract

My view has long been that if the world economy does not have enough energy resources, it will have to contract. The situation is analogous to a baker without enough ingredients to bake the size of cake he wants to make, or a chemist not being able to set up a full-scale model of a reaction. Perhaps, if a plan is made to make a smaller, differently arranged economy, it could still work.

The types of energy with inadequate supplies are both oil (particularly diesel and jet fuel) and coal. Diesel and jet fuel are especially used in long-distance transportation and in food production. Coal is particularly used in industrial activities. Without enough of these fuels, the world economy is forced to make fewer goods and services, and to make them closer to the end user. Somehow the economy needs to change.

My analysis indicates that our expectation of what goes wrong with inadequate energy supplies is wrong. Strangely enough, it is the finances of governments that start to fail, early on. They add too much debt to support investments that do not pay back well. They add too many programs that they cannot be supported for the long term. They become more willing to quarrel with other countries. Of course, no one will tell us what is really happening, partly because politicians themselves don’t understand.

In this post, I will try to explain some of the changes taking place as the economy begins to reorganize and deal with this inadequate energy supply situation.

[1] One energy limit we are hitting is with respect to “middle distillates.” This is the fraction of the oil supply that provides diesel and jet fuel.

Figure 1. Three different oil-related supply estimates, relative to world population. The top line shows oil production from the 2024 Statistical Review of World Energy, published by the Energy Institute. The second line shows international crude oil production, as reported by the US EIA, with data through October 2024. The bottom line shows middle distillates (diesel and jet fuel) relative to world population, using data from the 2024 Statistical Review of World Energy, published by the Energy Institute.

Each type of energy supply seems to be most suitable for particular uses. Middle distillates are the ones the economy uses for long distance transport of both humans and goods. Diesel is also heavily used in farming. If the world is short of middle distillates, we will have to figure out a way to make goods in a way that is closer to the end user. We may also need to use less modern farm equipment.

The top line on Figure 1 indicates that the world economy has gradually been learning how to use less total oil supply, relative to population. Before oil prices began to soar in 1973, oil with little refining was burned to produce electricity. This oil use could be eliminated by building nuclear power plants, or by building coal or natural gas electricity generation. Home heating was often accomplished by deliveries of diesel to individual households. Factories sometimes used diesel as fuel for processes done by machines. Many of these tasks could easily be transitioned to electricity.

After the spike in oil prices in oil prices in 1973, manufacturers started making cars smaller and more fuel efficient. In more recent years, young people have begun deferring buying an automobile because their cost is unaffordable. Another factor holding down oil usage is the trend toward working from home. Electric vehicles may also be having an impact.

On Figure 1, data for crude oil (second line) is available through October 2024. This data suggests that crude oil production has been encountering production problems recently. Note the oval labeled “Crude oil problem,” relating to recent production for this second line. The other two lines on Figure 1 are only through 2023.

The problem causing the cutback in oil production (relative to population) is the opposite of what most people have expected: Prices are not high enough for producers to ramp up production. OPEC, and its affiliates, have decided to hold production down because prices are not high enough. The underlying problem is that oil prices are disproportionately affected by what users can afford.

Food prices around the world are critically dependent upon oil prices. The vast majority of buyers of food, worldwide, are poor people. If budgets are stretched, poor people will tend to eat less meat. Producing meat is inefficient; it requires that animals eat a disproportionate number of calories, relative to the food energy they produce. This is especially the case for beef. A trend toward less meat eating, or even eating less beef, will tend to hold down the demand for oil.

Another approach to holding down food costs is to buy less imported food. If consumers choose to eat less high-priced imported food, this will tend to use less oil, especially diesel and jet fuel. Another thing customers can do to hold down food costs is to visit restaurants less. This also tends to reduce oil consumption.

On Figure 1, the third line is the one I am especially concerned about. This is the one that shows middle distillate (diesel and jet fuel) consumption. This is the one that was greatly squeezed down in 2020 by the restrictions related to Covid. Diesel is the fuel of heavy industry (construction and road building), as well as long distance transport and agriculture. Electricity is rarely a good substitute for diesel; it cannot give the bursts of power that diesel provides.

Close examination of the third line on Figure 1 shows that between about 1993 or 1994 and 2007, the consumption of middle distillates was rising relative to world population. This makes sense because international trade being ramped up, starting about this time. There was a dip in this line in 2009 because of the Great Recession, after which middle distillates per capita consumption noticeably leveled off. This flattening could be an early pointer to inadequacy in the middle distillate oil supply.

In 2019, middle distillate consumption per capita first started to stumble, falling 1.4% from its previous level. The restrictions in 2020 brought middle distillate consumption per capita down by 18% from the 2019 level. This was a far greater decrease than for total oil (top line on Figure 1) or crude oil (middle line). By 2023 (the latest point), per capita consumption had only partially recovered; the level was still below the low point in 2009 after the Great Recession.

Middle distillates can be found in almost any kind of oil, but the best supply is in very heavy oil. Examples of providers of such heavy oil are Russia (Urals), Canada (oil sands), and Venezuela (oil sands in Orinoco belt). The price for such heavy oil tends to lag behind the price for lighter crude oil because of the high cost of transporting and processing such oil.

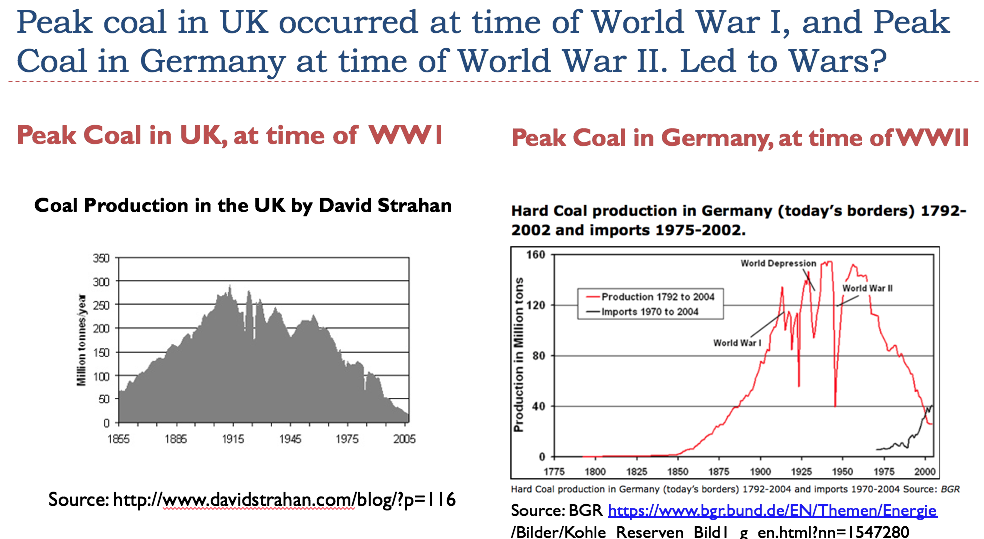
Strangely enough, countries that are not getting enough funds for their exported fossil fuels tend to start wars. My analysis suggests that at the time World War I started, the UK was not getting a high enough price for the coal they were trying to extract. The coal was getting more expensive to extract because of depletion. Germany had a similar problem at the time World War II started. The financial stresses of exporters who feel they are getting an inadequate price for their exported fossil fuels seems to push them toward wars.

We can speculate that the financial pressures of low oil prices have been somewhat behind Russia’s decision to be at war with Ukraine. The recent problems of Venezuela and Canada may also be related to the low prices of the heavy oil they are trying to extract and export.

Extracting a greater quantity of heavy oil would likely require higher prices for food around the world because of the use of diesel in growing and transporting food. Publications showing oil reserves indicate that there is a huge amount of heavy oil in the ground around the world; the problem is that it is impossible to get the price up high enough to extract this oil.

The existence of these heavy oil “reserves” is one of the things that makes many modelers think that our biggest problem in the future might be climate change. The catch is that we need to get the oil out at a price that consumers of food and other goods can afford.

[2] Another energy limit we are hitting is coal.

Coal energy is the foundation of the world’s industry. It is especially used in producing steel and concrete. Coal started the world industrial revolution. The primary advantage it has historically had, is that it has been inexpensive to extract. It is also fairly easy to store and transport. Coal can be utilized without a huge amount of specialized or complex infrastructure.

China produces and consumes more than half of the world’s coal. In recent years, it has been far above other countries in industrialization.

Figure 2. Chart by the International Energy Agency showing total fuel consumed by industry, for the top five fuel consuming nations of the world. TFC = Total Fuel Consumed. Chart from 2019.

World coal consumption per capita has been falling since about 2011. Arguably, world coal consumption was on a bumpy plateau until 2013, with world coal consumption per capita truly falling only during 2014 and thereafter.

Figure 3. World coal consumption per capita, based on data of the 2024 Statistical Review of World Energy, published by the Energy Institute, showing data through 2023.

This pattern of coal usage means that world industrialization has been constricted, especially since 2014. In fact, the restriction started as early as 2012. It became impossible for China to build as many new condominium apartment buildings as inexpensively as promised; this eventually led to defaults by builders. World steel output started to become restricted. The model of world economic growth, led by China and other emerging markets, began to disappear.

The problem coal seems to have is the same as the problem diesel has. There is a huge quantity of coal resources available, but the price never seems to rise high enough for long enough for producers to truly ramp up production, especially relative to the ever-growing world population. Coal is especially needed now, with intermittent wind and solar leaving large gaps in electricity generation that need to be filled by burning some fossil fuel. Coal is much easier to ship and store than natural gas. Oil is convenient for electricity balancing, but it tends to be high-priced.

[3] Political leaders created new narratives that hid the problems of inadequate middle-distillate and coal supplies.

The last thing we can expect a politician to tell his constituents is, “We have a shortage problem here. There are more resources available, but they are too expensive to extract and ship to provide affordable food, electricity, and housing.”

Instead, political leaders everywhere created new narratives and started to encourage investments following those new narratives. To encourage investment, they lowered interest rates (Figure 4), made debt very available, and offered subsidies. Governments even added to their own debt to support their would-be solutions to energy problems.

Figure 4. Returns on 3-month and 10-year US Treasury investments. Chart by Federal Reserve of St. Louis. Data through February 21, 2025.

Political leaders developed very believable narratives. These narratives were similar to Aesop’s Fable’s “Sour Grapes” story, claiming that the grapes were really sour, so the wolf didn’t really want the grapes he initially sought.

The popular narrative has been, “We don’t really want coal or heavy types of oil anyhow. They are terribly polluting. Besides, burning fossil fuels will lead to climate change. There are new cleaner forms of energy. We can also stimulate the economy by adding more programs, including more subsidies to help poor people.”

This narrative was supported by politicians in most energy-deficient countries. The increase in debt following this narrative seemed to keep the world economy away from another major recession after 2008. People began to believe that it was debt-based programs, especially those enabled by more US government spending, that pulled the economy forward.

They did not understand adding debt adds more “demand” for goods and services in general, and the energy products needed to make them. However, it doesn’t achieve the desired result if inexpensively available energy resources are not available to meet this demand. Instead, the pull of this demand will partly lead to inflation. This is the issue the economy has been up against.

[4] What could possibly go wrong?

There are a lot of things that have started to go wrong.

(a) US governmental debt is skyrocketing to an unheard-of level. Relative to GDP, the US Congressional Budget Office (CBO) projects that US debt will soon be higher than it was at the time of World War II.

Figure 5. Chart by the CBO showing US Federal Debt, as ratio to GDP, from 1900 to 2035. Source.

Notice that the latest surge in US government debt started in 2008, when the Federal Reserve decided to bail out the economy with ultra-low interest rates (Figure 4). A second surge took place in 2020, when the US government began more give-away programs to support the economy as Covid restrictions took place. The CBO forecasts that this surge in debt will continue in the future.

(b) Interest on US government debt has become a huge burden. We seem to need to increase government debt, simply to pay the ever-higher interest payments. This is part of what is driving the increased debt projected in the 2025 to 2035 period.

Figure 6 shows a breakdown of actual Fiscal Year 2024 US Federal Government spending by major categories.

Figure 6. Figure by Gail Tverberg, based on CBO breakdown of US government spending for FY 2024 given at this link.

Note that US government spending on interest payments ($881 billion) is now larger than defense payments ($855 billion). Part of the problem is that the ultra-low interest rates of the 2008 to 2022 period have turned out to be unsustainable. (See Figure 4.) As older debt at lower interest rates is gradually replaced by more recent debt at higher rates, it seems likely that these interest payments will continue to grow in the future.

(c) Continued deficit spending appears likely to be needed in the future.

Figure 7. Chart by CBO showing annual deficit in two pieces–(a) the amount simply from spending more than available income, and (b) interest on outstanding debt. Source.

The CBO estimates in Figure 5 seem likely to be optimistic. In January 2025, the CBO expected that inflation would immediately decrease to 2% and stay at that level. The CBO also expects the primary deficit to fall.

(d) The shortfall in tax dollars cannot easily be fixed.

Today, tax dollars mostly come from American taxpayers, either as income taxes or as payroll taxes.

Figure 8. Past and Expected Sources of US Federal Government Funding, according to the CBO.

A person can deduce that to stop adding to the deficit, additional taxes of at least 5% or 6% of GDP (which is equivalent to 12% to 14% of wages) would be needed. Doubling payroll taxes might provide enough, but that cannot happen.

Corporate income taxes collected in recent years have been very low. US companies are either not very profitable, or they are using international tax laws to provide low tax payments.

(e) The incredibly low interest rates have encouraged all kinds of investment in projects that may make people happy, but that do not actually result in more goods and services, or more taxable income.

Figure 8 shows that US corporate income taxes have been falling over time. The reason is not entirely clear, but it may be that companies set their sights lower when the return that is required to pay back debt with interest is low. All the subsidies for wind, solar, electric vehicles, and semiconductor chips have focused the interest of businesses on devices that may or may not be generating a huge amount of taxable income in the future.

I have written articles and given talks such as, Green Energy Must Generate Adequate Taxable Income to Be Sustainable. Green energy can look like it would work if a person uses a model with an interest rate near zero, and policies that give renewable electricity artificially high prices when it is available. The problem is that, one way or another, the system as a whole still needs to generate adequate taxable income to keep the government operating.

Of course, many of the investments with the additional debt have been in non-energy projects. There have been do-good projects around the world. Young people have been encouraged to go to college using debt repayable to the government. Government funding has supported healthcare and pensions for the elderly. But do these many programs truly lead to higher tax dollars to support the US government? If the economy truly were very rich (lots of inexpensive surplus energy), it could afford all these programs. Unfortunately, it is becoming clear that the US has more programs than it can afford.

(f) The ultra-low interest rates have encouraged asset price bubbles and wealth disparities.

With ultra-low interest rates and readily available debt, property prices tend to rise. Investors decide to buy homes and “flip” them. Or they buy them, and plan to rent them out, hopefully making money on price appreciation.

Stock market prices are also buoyed by the readily available debt and low interest rate. The US S&P 500 stock market has provided an annualized return of 10.7% per year since 2008, while International Markets (as measured by the MSCI EAFE index) have shown a 3.3% annual return for the same period, according to Morningstar. The huge increase in US government debt no doubt contributed to the favorable S&P 500 return during this period.

Wealth disparities tend to rise in an ultra-low interest period because the rich disproportionately tend to be asset owners. They are the ones who use “leverage” to get even more wealth from rising asset prices.

(g) Tensions have risen around the world, both between countries and among individual citizens.

The underlying problem is that the system as a whole is under great strain. Some parts of the system must get “shorted” if there is not enough coal and certain types of oil to go around. Politicians sense that China and the US cannot both succeed at industrialization. There is too little coal, for one thing. China is struggling; quite often it seems to be trying to try to “dump” goods on the world market using subsidized prices. This makes it even more difficult for the US to compete.

Individual US citizens are often unhappy. With the bubble in home prices and today’s interest rates, citizens who are not now homeowners feel like they are locked out of home ownership. Inflation in the cost of rent, automobiles, and insurance has become a huge problem. People who work at unskilled hourly jobs find that their standard of living is often not much (or any) higher than people who choose to live on government benefits rather than work. Fairly radical leaders are voted into power.

[5] The major underlying problem is that it really takes a growing supply of low-priced energy products to propel the economy forward.

When plenty of cheap-to-extract oil and coal are available, growing government debt can help to encourage their development by adding to “demand” and raising the prices consumers can afford to pay. High prices of oil and coal become less of a problem for consumers.

Figure 9. Average annual Brent equivalent oil prices, based on data of the 2024 Statistical Review of World Energy, published by the Energy Institute.

But when energy supply of the required types is constrained, the additional buying power made available by added debt tends to lead to inflation rather than more finished goods and services. This inflationary tendency is the problem the US has been contending with recently.

Strangely enough, I think that growing inexpensive coal supply supported the world economy, as oil prices rose to a peak in 2011. As China industrialized its economy using coal, its demand for oil rose higher. The higher world demand coming from this industrialization helped to raise oil prices. But as coal supply (relative to world population) began to fall, oil prices also began to fall. By 2014, the decline in industrial production caused by the lower coal supply (Figure 3) likely contributed to the fall in oil prices shown on Figure 9.

It is the fact that oil prices have not been able to rise higher and higher, even with added government debt, which is inhibiting oil production. World coal production is inhibited by a similar difficulty.

[6] The world economy seems to be headed for a major reorganization.

The world economy seems to be headed in the direction that many, many economies have encountered in the past: Collapse. Collapse seems to take place over a period of years. The existing economy is likely to lose complexity over time. For example, with inadequate middle distillates, long-distance shipping and travel will need to be scaled way back. Trading patterns will need to change.

Governments are among the most vulnerable parts of economies because they operate on available energy surpluses. The collapse of the Central Government of the Soviet Union took place in 1991, leaving in place more local governments. Something like this could happen again, elsewhere.

I expect that complex energy products will gradually fail. Gathering biomass to burn is, in some sense, the least complex form of supplemental energy. Oil and coal, at least historically, have not been too far behind, in terms of low complexity. Other forms of today’s human-produced energy supply, including electricity transmitted over transmission lines, are more complex. I would not be surprised if the more complex forms of energy start to fail, at least in some parts of the world, fairly soon.

Donald Trump and the Department of Government Efficiency seem to be part of the (unfortunately) necessary downshift in the size of the economy. As awful as may be, something of this sort seems to be necessary, if the US government (and governments elsewhere) have greatly overpromised on what goods and services they can provide in the future.

The self-organizing economy seems to make changes on its own based on resource availability and other factors. The situation is very similar to the evolution of plants and animals and the survival of the best adapted. I believe that there is a God behind whatever changes take place, but I know that many others will disagree with me. In any event, these changes cannot take place simply because of the ideas of a particular leader, or group of leaders. There is a physics problem underlying the changes we are experiencing.

There is a great deal more that can be written on this subject, but I will leave these thoughts for another post.

Posted in Financial Implications, News Related Post | Tagged , , , | 1,771 Comments

Southeast Asia can perhaps avoid the worst impacts of inadequate oil supply

Some of my frequent commenters know that I recently returned from a visit to Southeast Asia. In this post, I would like to present a little energy-related information about this part of the world. Most of my information is from published energy reports, but a little is from my visit to Thailand, Cambodia, and Vietnam. I have included these countries in my Southeast Asia totals, plus Indonesia, Malaysia, the Philippines, Singapore, and (to the extent I could find the data), amounts for a few other small countries included in the grouping used by the United Nations in its “Southeast Asia” grouping.

While Southeast Asia shares most of the energy problems of the rest of the world, it seems to me that this region is somewhat better placed to handle the energy shortfalls that lie ahead than many other regions. Southeast Asia’s warm, wet climate is helpful, as is its supply of coal, particularly in Indonesia. Many of the people in this part of the world are used to living in cramped quarters–three generations in a large one-room home, for example. Abundant forests provide a renewable source of energy. Religious traditions help provide order. These factors may work together to allow the economies of these countries to continue to some extent, even as much of the rest of the world pushes in the direction of collapse.

[1] Southeast Asia is finding it must import ever-larger amounts of oil to meet the needs of its growing economies.

Figure 1. Oil production and consumption are from the 2024 Statistical Review of World Energy, published by the Energy Institute. Oil imports are calculated by subtraction.

Figure 1 shows that Southeast Asia produces a little oil itself. This oil production (blue line) reached a peak in 2000 and has fallen since then. Such a pattern is common among the countries of the world–oil production starts falling once the easily extracted oil is removed.

Southeast Asia’s oil consumption (orange line) has generally been growing. Up until 1993, the area produced enough oil for its own needs. More recently, Southeast Asia’s oil needs have been met through increasing imports of oil. Thus, Southeast Asia has been a net importer of oil for over 30 years. With reduced travel related to Covid in 2020 and 2021, there was a dip in consumption and imported oil in these years. By 2023, however, consumption was back above 2019 levels, and imports were higher than in 2019.

[2] Natural gas production in Southeast Asia reached a peak in 2015, and it has been declining ever since.

The situation with natural gas production is similar to that of oil. Southeast Asia’s natural gas supply reached a peak in 2015, and it has been falling ever since.

Figure 2. Natural gas production and consumption are from the 2024 Statistical Review of World Energy, published by the Energy Institute. Natural gas imports are calculated by subtraction.

Figure 2 shows that once natural gas production (blue line) began to decline, Southeast Asian natural gas consumption (orange line) started to flatten out and even decline a bit. Natural gas exports began to decline, as well, beginning more than a decade before the peak in production was reached. Some of the natural gas exports are liquefied natural gas exports, under long term contracts. These cannot easily be cut back because of inadequate production.

Today, in many parts of the world, there is high demand for natural gas to balance out electricity generated by wind and solar. Southeast Asia, which has a declining supply of natural gas available for export, cannot provide much natural gas to help the countries dealing with this intermittency problem. But, as we will see, Southeast Asia itself seems to have mostly stayed away from wind and solar. This is a plus.

It seems likely that both oil and natural gas extraction within Southeast Asia will continue to decline. This is a worry for the future.

[3] Southeast Asia’s coal supply has been growing, helping to support its industry and exports.

Coal production is still growing in Southeast Asia, with Indonesia being the primary source of production.

Figure 3. Coal production and consumption are from the 2024 Statistical Review of World Energy, published by the Energy Institute. Coal imports are calculated by subtraction.

A recent report says that coal production in Indonesia in 2024 increased by 7.1% over production in 2023, showing that growth in coal production continues. Malaysia, Thailand, and Vietnam are all importers of coal, much of which likely comes from Indonesia.

[4] Southeast Asia’s per capita energy consumption has been rising, due to increasing coal consumption and the addition of other types of energy, made possible by fossil fuels.

Figure 4. Per capita energy consumption by type, based on data of the 2024 Statistical Review of World Energy, published by the Energy Institute.

Hydroelectricity seems to be the single largest category of “All Other” energy supply. Building dams to produce hydro-electric power has been made possible by the availability of coal to produce concrete and steel.

Another major category of “All Other” seems to be the burning of wood chips.

Figure 5. Place in Vietnam where trees on the side of a mountain were being clearcut to provide wood chips. We were told that the area would be reforested with a rapidly growing species that would again be clearcut.

A third category of “All Other” energy production is geothermal power. Both Indonesia and the Philippines generate electric power using geothermal energy. Geothermal works best when a country has volcanic mountains that can provide the high temperatures required. Southeast Asia seems to have more than its share of volcanoes.

Wind turbines and solar panels seem to be relatively little used in this part of the world. Nuclear does not seem to be used at all in this part of the world.

This combination of All Other energy supply seems to be more stable than the more common “wind and solar” version of All Other energy supply. Also, nuclear electricity now seems to have a uranium supply problem, as I discussed in a recent post. It is a high-tech solution that poor countries, such as those in Southeast Asia, are likely to have considerable problems trying to emulate.

[5] Southeast Asia has multiple advantages that allow its population to get along with relatively little energy, if fossil fuels become less available.

As mentioned in the introduction, the mild climate of Southeast Asia allows people to get along without heating or cooling their homes. In fact, homes don’t need to be very substantial if they don’t need insulation. They can easily be rebuilt with local materials.

On our trip, we saw several one-room homes in which up to three generations lived together. Of course, people everywhere would like fancy homes with lots of rooms, indoor bathrooms, and heating and cooling. But these things require fossil fuels, both to initially build and to maintain. If people can learn to live in very modest housing, it greatly reduces the fossil fuel energy needs of an economy.

It seems to me that if the world is heading in the direction of not enough fossil fuels, Southeast Asia is a region that can get along without much harm, even on less fuel than is available today. Farming seems to be done with little use of fuel, right now. Many families are used to living in shared living spaces. Daily markets, selling meat, including live chickens and ducks, seem to be common.

Based on my calculations, the per-capita energy consumption of Southeast Asia is about half that of China and about 21% of the US’s average per-capita energy consumption.

Economies in warm, wet climates have an advantage because agriculture can be done year-around. Without fossil fuels, Southeast Asia would not be able to support as large a population as today, but it seems likely that these countries could still support a substantial, if lower, population. The Garden of Eden mentioned in the Book of Genesis in the Bible seemed to have some of the characteristics of Southeast Asian countries today. If “warm and wet” was a solution in the early days, it may be a solution in the future.

[6] Southeast Asia has nowhere near the scale of energy supplies to replace China, with its huge industrial output.

Figure 6. Total electricity production of Southeastern Asia compared to that of China (excluding Hong Kong), based on data of the 2024 Statistical Review of World Energy, published by the Energy Institute.

China’s electricity production in 2023 was 23.0 times its electricity production in 1985. Southeast Asia’s electricity production in 2023 was 12.8 times its electricity production in 1985. Thus, China’s growth rate has been close to twice as fast as Southeast Asia.

While China’s rapid growth has been impressive, it is very hard to maintain. Southeast Asia’s slower growth curve, which is still somewhat rising, would seem to be easier to maintain. If it does start to fall, it will hopefully be a slower fall.

[7] Indonesia, which is part of Southeast Asia, is a world leader in coal production.

Coal tends to be an inexpensive source of heat and electricity and is essential in making steel. The industrial revolution around the world was started with the use of coal. Coal is still used heavily in manufacturing. While the wealthy countries of the world talk a great deal about carbon dioxide and climate change, the poorer countries of the world–including those in Southeast Asia–continue to use coal, to the extent it is available.

Worldwide, China is number one in coal production (93.10 exajoules), according to the 2024 Statistical Review of World Energy. India is in second place, with production of 16.65 exajoules. Indonesia is close behind in third place, with coal production of 15.73 exajoules. The advantage that Indonesia has is that its population (281,000) is much lower than that of India (1.4 billion), so that its coal-benefit relative to population is much greater than that of India.

I don’t think that we know how long coal production will continue to grow. Theoretically, how long production will continue to grow is tied to the amount of coal reserves, but it is questionable whether today’s published reserve numbers are very useful in determining the quantity available at a price customers are willing to pay. The 2024 Statistical Review of World Energy report shows quite low coal reserves for Southeast Asia, and quite high coal reserves for the US, Russia, and Australia. This same report has a note at the top of the page showing coal reserves that says, “The methodology and timing of updating reserve numbers is under review.” The authors of the report seem to be saying, “Expect big revisions of these reserve numbers in the future.”

[8] People of Southeast Asia seem to have a tradition of being hard working and co-operative.

One report describes the work culture of Southeast Asia as “Community oriented, with respect for seniors, and flexibility.” The same report indicates that maintaining a calm demeanor and not showing anger in public are important in countries like Thailand and Indonesia. The article indicates that smiling plays a critical role in communication, keeping the interactions positive.

My husband and I were impressed by how happy the Buddha figures seemed to be.

Figure 7. Happy Buddha statue in southern Vietnam.

Religions seem to help provide a safety net for the poor. Working as a priest gives an option for income for those who would otherwise be unemployed and are willing to study.

[9] The world economy, including Southeast Asia, is already beginning to encounter oil shortfalls. One way they affect the economy is through less growth in long-distance tourism.

There is a temptation to believe that the tourist trade will grow, allowing the economies of Southeast Asia to grow at the same time. However, it is becoming apparent that this doesn’t necessarily work well in a world struggling with inadequate oil supplies.

We saw many examples of buildings, including entire resorts, that had been started and apparently abandoned. In particular, Cambodia seemed to have many buildings that were started as Chinese investments. We were told that these structures had been left without being completed, in or around 2020.

The northern part of Vietnam seemed to be experiencing some of the same difficulty. This partly completed building is from Da Nang, a coastal city in what was formerly North Vietnam.

Figure 8. A building in the Da Nang, Vietnam, area that seemed to have been abandoned before it was completed.

[10] We will have to wait and see how things really turn out.

Southeast Asia seems to be able to feed an awful lot of people with its rice fields and fish farms, operated with very little fossil fuel input.

Figure 9. A rice farm in Vietnam. White “flags” are to scare away birds.

There are a lot of pieces of the story we don’t understand. Without enough oil, people may need to stay closer to home. But quite a few people in warm, humid climates may be able to get along, for quite a while, with very modest living arrangements.

Posted in Planning for the Future | Tagged , | 1,673 Comments

An Energy and the Economy Forecast for 2025

As the world enters 2025, the critical issue we are facing is Peak Crude Oil, relative to population. Crude oil has fallen from as much as .46 gallons per person, which was quite common before the pandemic, to close to .42 gallons per person recently (Figure 1).

Figure 1. World crude oil production per person, based on data of the US EIA. Data through September 2024.

People have a misimpression regarding how world peak oil can be expected to behave. The world economy has continued to grow, but now it is beginning to move in the direction of contraction due to an inadequate supply of crude oil. In fact, it is not just an inadequate crude oil supply, but also an inadequate supply of coal (per person) and an inadequate supply of uranium.

We know that when a boat changes direction, this causes turbulence in the water. This is similar to the problems we are currently seeing in the world economy. Physics dictates that the economy needs to shrink in size to match its energy resources, but no country wants to be a part of this shrinkage. This indirectly leads to major changes in elected leadership and to increased interest in war-like behavior. Strangely enough, it also seems to lead to higher long-term interest rates, as well.

In this post, I share a few thoughts on what might lie ahead for us in 2025, in the light of the hidden inadequate world energy supply. I am predicting major turbulence, but not that things fall apart completely. Stock markets will tend to do poorly; interest rates will remain high; oil and other energy prices will stay around current levels, or fall.

[1] I expect that the general trend in 2025 will be toward world recession.

With less oil (and coal and uranium) relative to population, the world can be expected to produce fewer goods and services per person. In some sense, people will generally become poorer. For example, fewer people will be able to afford new cars or new homes.

This trend toward lower purchasing-power tends to be concentrated in certain groups such as young people, farmers, and recent immigrants. As a result, older people who are well-off or firmly established may be able to mostly ignore this issue.

While the shift toward a poorer world has partially been hidden, it has been a huge factor in allowing Donald Trump to be voted back into power. Major shifts in leadership are taking place elsewhere, as well, as an increasing share of citizens become unhappy with the current situation.

[2] Many governments will try to hide recessionary tendencies by issuing more debt to stimulate their economies.

In the past, adding debt was found to be effective way of stimulating the world economy because energy supplies supporting the world economy were not seriously constrained. It was possible to add new energy supplies, quite inexpensively. The combination of additional inexpensive energy supplies and additional “demand” (provided by the added debt) allowed the total quantity of goods and services produced to be increased. Once energy supplies started to become seriously constrained (about 2023), this technique started to work far less well. If energy production is constrained, the likely impact of added debt will be added inflation.

The problem is that if added government debt doesn’t really add inexpensive energy, it will instead create more purchasing power relative to the same number, or a smaller number, of finished goods and services available. I believe that in 2025, we are heading into a situation where ramping up governmental debt will mostly lead to inflation in the cost of finished goods and services.

[3] Energy prices are likely to remain too low for fossil fuel and uranium producers to raise investments from their current low levels.

Recession and low prices tend to go together. While there may be occasional spikes in oil and other energy prices, 2025 is likely to bring oil and other energy prices that are, on average, no higher than those of 2024, adjusted for the overall increase in prices due to inflation. With generally low prices, producers will cut back on new investment. This will cause production to fall further.

[4] I expect “gluts” of many energy-related items in 2025.

Gluts are related to recession and low prices for producers. The underlying problem is that a significant share of the population finds that finished goods, made with energy products and investment at current interest rates, are too expensive to buy.

Even farmers are affected by low prices, just as they were back at the time of the Great Depression. We can think of food as an energy product that is eaten by people. Farmers find that their return on farm investment is too low, and that their implied wages are low. Low income for farmers around the world feeds back through the system as low buying power for new farm equipment, and for buying goods and services in general.

In 2025, I expect there will be a glut of crude oil due to a lack of purchasing power of many poor people around the world. My forecast is similar to the forecast of the IEA that predicts an oversupply of oil in 2025. Also, a December 2024 article in mining.com says, “A glut of coal in China is set to push falling prices even lower.”

Even wind turbines and solar panels can reach an oversupply point. According to one article, number of Chine solar panel builders seems to be far too high for world demand, leading to a potential shake out. As the share of wind and solar power added to the electric grid increases, the frequency of low or negative payment for wholesale electric power increases. This makes adding more wind turbines and solar panels problematic, after a certain point. We don’t yet have a cost-effective way of storing intermittent electricity for months on end. This seems to be part of the reason why there recently were no bidders for producing more offshore wind power in Denmark.

[5] I expect long-term interest rates to remain high. This will be a problem for new investments of all kinds and for governmental borrowing.

In Section 2 of this post, I tried to explain that a peak-oil impact is likely to be inflation. This occurs because ramping up debt to try to stimulate the economy no longer works to get additional cheap energy products from the ground. Instead of getting as many finished goods and services as hoped for, the added debt tends to produce inflation instead.

I believe that we are reaching a stage of fossil-fuel depletion where it is becoming increasingly difficult to ramp up production, even with added investment. Because of the added debt added in an attempt to work around depletion, inflation in the price of finished goods and services can be expected. Investors are beginning to see long-term inflation as a likely problem. As a result, they are starting to demand higher long-term interest rates to compensate for the expected decrease in buying power.

Figure 2. Interest rates on 10-year US Treasury Securities, in a chart by the Federal Reserve of St. Louis. Data is through December 30, 2024.

Figure 2 shows that US long-term interest rates have varied widely. There was a period of generally dropping long-term interest rates from 1981 to 2020. Starting in late 2020, interest rates began to rise; in 2023 and 2024 they have been in the 4% to 5% range. These relatively high rates are occurring because lenders are demanding higher long-term interest rates in response to higher inflation rates.

Because of inflationary pressures, I expect that long-term interest rates will tend to stay at today’s high level in 2025; they may even rise further. These continued high interest rates will become a problem for many families wanting to purchase a home because US home mortgage rates rise and fall with US 10-year interest rates. Often families are faced with both high home prices and high interest rates. This combination makes mortgage costs a problem for many families.

Governments are also adversely affected. They tend to hold large amounts of debt that they have accumulated over a period or years. Up until 2020, much of this added debt often was at a very low interest rate. As more long-term debt at higher interest rates is added, annual interest rate payments tend to rise rapidly. This can cause a need to raise taxes. Japan, especially, would be affected by higher interest rates because of its high level of government debt, relative to GDP.

Higher interest rates will also raise costs for citizens trying to finance the purchase of homes, and for investors wanting to build wind turbines or solar panels. In fact, investment in any kind of factory, pipelines, or electricity transmission will tend to become more expensive.

In a sense, we seem to be seeing the peak oil problem shifting in a way that affects interest rates and the economy in general. Either higher interest rates or higher oil prices will tend to push the economy toward recession. We tend to look for rising prices to signal an oil supply problem, but perhaps that only works when there is excessive demand. If the problem is really inadequate oil supply, perhaps we should look for higher long-term interest rates, instead.

[6] Industry around the world is likely to be hit especially hard by recessionary tendencies.

Industry requires investment. Higher interest rates make new industrial investment more expensive. Industry is also a heavy user of energy products. Putting these observations together, it shouldn’t come as a surprise if new industrial investment is one of the first places to be cut back because of peak oil supply.

Figure 3. Expected world industrial output, based on calculations I made with using industrial output and population forecasts from detailed output data provided with the article Recalibration of limits to growth: An update of the World3 model” by Arjuna Nebel et al.

The original 1972 Limits to Growth analysis, in its base model, suggested that resources would start to run short about now. The variables in this model were recently recalibrated in the article, “Recalibration of limits to growth: An update of the World3 model.” Based on the detailed data given in the endnotes to the article, I calculated the expected industrialization per capita shown in Figure 3.

Based on Figure 3, this model shows that industrialization per person reached a peak in 2017. Peak industrialization (total, not per capita) occurred in 2018, which coincides with peak crude oil extraction (not per capita).

The model seems to suggest that after an inflection point in 2023 (that is 2024 and after), industrialization will start to fall more steeply. The model shows a decrease in production per capita of 4.1% in 2024 and of 5.3% in 2025. Such decreases would push the world economy toward recession.

The model suggests that people, on average, are getting poorer in terms of the quantity of goods and services they can afford to buy. New cars, motorcycles, and homes are becoming less affordable. Heavily industrialized countries, such as China, South Korea, and Germany are likely to be especially affected by headwinds to industrialization. I expect that the economic problems in these countries will continue and are likely to worsen in 2025.

[7] The US has tried to isolate itself from this nearly worldwide recession. I expect that during 2025, the US will increasingly slip into recession, as well.

There are several reasons for this belief:

(a) The US is heavily dependent upon imports of raw material. China is restricting exports of critical minerals used by the US. This will make it very difficult or impossible to ramp up high tech industries as planned.

(b) The US is heavily dependent on Russia for supplies of enriched uranium. Any plan for added nuclear electricity needs to consider where the uranium to power these plants will come from. It also needs to consider how this uranium will be enriched to the required concentration of uranium-235.

(c) If the US can ramp up crude oil and natural gas production, this can perhaps counter this trend toward US and world recession. Unfortunately, recent US oil supply has not been ramping up; instead its production has been fairly flat. Natural gas production has actually been lower since February 2024. Plans have been made to rapidly ramp up US liquefied natural gas (LNG) exports, but these plans cannot work if the US natural gas supply is already decreasing.

(d) The US government has had an advantage in borrowing because the US dollar is the world’s reserve currency. As such, the US is, in some sense, the first borrower, pulling the rest of the world along. The US, by making its short term interest rates higher than those of many other countries, was able to largely escape recession 2023 and 2024. Additional investment was attracted to the US by these higher interest rates. But the US cannot follow this strategy indefinitely. For one thing, a high US dollar handicaps exports. For another, interest costs on government debt become burdensome.

(e) Donald Trump has plans to close inefficient parts of government. These changes, if enacted, will reduce “demand” within the economy because workers in these sectors will lose their jobs. Over the longer term, these changes might be beneficial, but over the short term, they are likely to be recessionary.

(f) It is difficult for the US to do much better than the rest of the world. If the rest of the world is in recession, the US will tend to head in that direction, as well.

[8] I expect more conflict in 2025, but today’s wars will not look much like World War I or World War II.

Today, not many countries are able to build huge fleets of fighter airplanes. Even building drones and bombs seems to require supply lines that extend around the world. So, instead, wars are being fought in non-military ways, such as with sanctions and tariffs.

I expect that this trend away from direct military conflict will continue, with more novel approaches such as internet interference and stealth damage to infrastructure taking place instead.

I do not expect that nuclear bombs will be used, even when there is direct conflict between powerful adversaries. For one thing, uranium in these bombs is needed for other purposes. For another, there is too much chance of retaliation.

[9] I expect many types of capital gains will be low in 2025.

The situation we are facing now is the opposite of the drop in long-term interest rates observed between 1981 and 2020, in Figure (2), above. This historical drop in interest rates made it possible for businesses to more easily finance new investments. It also made it possible for individual citizens to be able to afford more homes and cars. It should not be surprising that this period has been a time of rising stock market prices, especially in the United States.

The world’s economic problem is that it no longer has the tailwind of falling long-term interest rates. Instead, rising long-term interest rates are becoming a headwind. Home prices are un-affordably high for most potential buyers at today’s interest rates. A similar problem faces those hoping to purchase agricultural equipment and farmland at today’s high prices and high interest rates.

We should not be surprised if home and farm prices stabilize and begin to fall. Prices of shares of stock are likely to encounter similar headwinds. Prices of derivative investments may perform even worse than the shares themselves.

Recently, a great deal of the strength of the US market has been in a few stocks. Artificial Intelligence (AI) needs to very quickly provide a lot of benefit to the stock market as a whole for this to change. I cannot imagine this happening. With the US slipping toward recession, I expect that the US stock market will at best plateau in 2025.

[10] With less energy available and higher interest rates on government debt, I expect to see more government organizations disbanding.

It takes energy, directly and indirectly, to operate any kind of governmental organization. Eliminating governmental organizations is one way of saving energy. This is what happened when the central government of the Soviet Union collapsed in 1991. I would think that parallel kinds of changes could start happening in the next few years, in many parts of the world.

At some time, perhaps as soon as 2025, the European Union could collapse. If things are going badly for many member countries, they will be less willing to support the European Union with their tax revenues. Other organizations that seem like they could be in peril include NATO and the World Trade Organization.

In some ways, such shrinkage would be in parallel with Trump’s plan for eliminating unnecessary governmental organizations within the United States. All these organizations require energy; cutting their number would go some way toward reducing crude oil and other energy consumption.

[11] It is possible that the world economy will eventually get itself out of its apparent trend toward recession, but I am afraid this will happen long after 2025.

We know that the world economy tends to operate in cycles. We would like to believe that the apparent current down-cycle is just temporary, but we can’t know this for sure. Physics tells us that we need energy supplies of the right kind for any action that contributes to GDP. Running short of energy supplies is therefore a very worrisome condition.

We also know that there are major inefficiencies in current approaches. For example, oil extraction leaves much of the oil resource in place. In theory, AI could greatly improve extraction techniques.

We also know that uranium consumption is terribly inefficient. M. King Hubbert thought that nuclear energy using uranium had amazing potential, but most of this potential remains untapped. Perhaps AI could help in this regard, also. If nothing else, perhaps recycling spent fuel could be made less expensive and problematic.

Figure 4. Figure from Hubbert’s 1956 paper, Nuclear Energy and the Fossil Fuels.

We can’t know what lies ahead. There may be a “religious” ending to our current predicament that we are discounting that is actually the “right story.” Or there may be a “technofix” solution that allows us to avert collapse or catastrophe. But for now, how the current down-cycle will end remains a major cause for concern.

Posted in Financial Implications | 1,716 Comments

The world economy needs to simplify

Economic growth and added complexity sound like they would be good, but at some point, the combination gets to be too much–simplification is needed.

Too much of the world’s income starts going to non-working individuals and to high-earning workers in privileged fields. Ordinary working citizens start to say, “Wait a minute, there is not enough left for my everyday expenses. The system needs to change.” Elections lead to the selection of politicians who want war, or who want to overturn the current system. The system then changes in a way that leads to less spending on healthcare and other complexities.

Figure 1. US healthcare expenses as a percentage of GDP, based on data of the US Center for Medicare and Medicaid Services.

In this post, I will try to explain a bit of the underlying problem and give some hints at what the simplification might look like. Part of the problem is too little energy supply. This is a problem that cannot be told to the public; it would be too distressing. In this post, I present the result of a recent academic study that has attempted to recalibrate the findings of the 1972 Limits to Growth study with updated data.

[1] Economies of all types tend to operate in cycles.

Economies need both resources and human participants. Human populations tend to increase in number if conditions are favorable. When population grows, resources per capita, such as arable land and fresh water, tends to fall. Adding complexity helps an economy work around falling resources per capita.

With added complexity, it is possible for resource extraction of many kinds to grow, at least for a time. Deeper wells can sometimes add more fresh water supply. Irrigation and fertilizer can be used to increase crop yields. International trade allows the possibility of getting resources from more distant lands. Adding debt allows factories to be built and to be paid for “after the fact,” using the sales of the goods produced by the factories. Ever-larger governments allow more roads, schools, and services of all kinds.

The use of added complexity helps keep economies growing for a long time, but at some point, things start going wrong. Oil wells and other types of resource extraction become more expensive to build because the easiest to extract resources tend to be used first. Pollution becomes more of a problem. Universities start producing more graduates with advanced degrees than there are job openings paying enough to justify studying for those degrees. Healthcare costs become hugely expensive. Increasing interest on debt becomes a huge burden, both for governments and individual citizens.

When added complexity reaches a limit, citizens sense a problem. They tend to vote the current governments out of power. Or they become rebellious in other ways. I think the world has already reached a complexity limit.

[2] At some point, the added complexity trend needs to shift toward simplification.

When added complexity no longer has sufficient payback, the system seems to sense this and starts pushing economies in the opposite direction. Often, the wages of ordinary workers become too low, relative to the cost of living. They rebel and overthrow their governments. Or central governments may collapse, as the central government of the Soviet Union did in 1991. This happened after oil prices were low for an extended period. The Soviet Union was an oil exporter, depending on oil exports for tax revenue. Revenue from collectivized agriculture was underperforming, also. Thus, getting rid of a layer of government, or too many government programs, seems to be one common theme of simplification.

Another issue today is international trade. Crude oil supplies per capita are low. Somehow, international trade (which uses crude oil) needs to be cut back.

Figure 2. World crude oil production per person, based on data of the US EIA.

With inadequate total oil supplies available, it becomes very desirable to do manufacturing close to home, rather than at a distance. This is a major reason for the competition in manufacturing between the US and China. If the US can manufacture locally, it will provide jobs and save some of the limited world crude oil supply.

Another issue is the oversupply of workers with advanced degrees, relative to the number of jobs requiring such degrees. A study released in early 2024 indicates that only about half of US college graduates are able to obtain a job requiring a college level degree within a year of graduation. In fact, the majority of those who cannot obtain a job requiring a college-level degree within a year after graduation remain underemployed 10 years after graduation. Pretty clearly, the number of college graduates needs to fall.

I showed in Figure 1 that US healthcare costs are very high, but they have recently been on a plateau. Perhaps these high healthcare expenses might make sense if US life expectancies were longer than elsewhere, thanks to all this spending. In fact, US life expectancy at birth is lower than in any other advanced nation. The CIA Factbook ranks the US life expectancy as 49th from the top in 2024.

Figure 3.

Figure 3 (above) shows a chart I found several years ago, showing how US female life expectancy has been dropping, relative to other high-income countries.

Figure 4.

Figure 4 shows that US life expectancies have continued to fall relative to other advanced economies. Something is clearly going wrong with health in the United States. It is no wonder that Robert F. Kennedy, Jr. wants to “Make America Healthy Again.”

There is also the question of the level of US healthcare spending, relative to GDP. The share for the US, from Figure 1, is about 17%. The shares for the EU, the UK, and Japan are each about 11% according to the World Bank. The share for Russia is about 7%; for China it is about 5%.

Another issue mentioned in the introduction is the proportion of government spending that goes toward non-working individuals. The chart below shows how US Federal Government funds are spent. When the budget is prepared, often many of these programs are lumped together as “Mandatory Spending,” so we don’t see precisely what the spending is for.

Figure 5. How US Federal Government spending was split in the fiscal year ended September 30, 2023, according to a chart by the Center on Budget and Policy Priorities.

Typically, the arguments about spending are on the parts of the budget other than mandatory spending. The problem is that all parts need to be funded, one way or another. Social Security describes its program as largely pay as you go. Mostly, the payroll taxes collected from today’s workers are used to pay benefits to today’s recipients. 

Keeping the system working as it does today becomes a problem if the total amount of goods and services produced starts falling at some point. For example, if the total food supply at some point (say 2050) becomes too low, there is a question regarding which citizens should get inadequate food rations: the workers, or those receiving benefits under a pension program for the elderly. I would vote for the workers getting adequate food, if we expect them to continue to work. This issue suggests that at some point, the elderly may have to go back to work to get an adequate share of what is being produced.

[3] I see the results of the recent US presidential election to be a call for simplification: getting rid of the unneeded pieces of the system.

Donald Trump and his team clearly have a much different view of how the government should be operated than Joe Biden did. In particular, the new team would like to get rid of what they see as unneeded parts of the system.

There seem to be many other parts of the world encountering somewhat similar political and funding difficulties. Germany is dealing with a collapse of government. France is facing political and budget crises. Even China’s economy is having huge difficulties.

[4] I see the underlying problem as not enough resources, especially energy resources, for the rising world population.

It is not only oil that is in short supply (Figure 2); coal is also in short supply, relative to world’s population (Figure 6).

Figure 6. World coal consumption per capita, based on data of the 2024 Statistical Review of World Energy, produced by the Energy Institute.

Uranium is in short supply, as well. The issue for uranium is that the world’s supply of nuclear warheads that could temporarily serve as a supplement to currently mined uranium is running short. These warheads belonged primarily to the US and to Russia, but Russia has sold a substantial amount of its warheads to the US, to be down-blended for use in nuclear power reactors.

Figure 7. Chart from ArmsControl.org showing estimated global nuclear warhead inventories, 1945 to 2023.

Without enough energy resources per person, the world will likely need to produce fewer goods and services in total. Some uses for energy products, and for the goods and services that can be made with energy products, need to disappear.

Now, all parts of the world need to re-examine energy uses that are currently being made and look for uses that the economy can most easily get along without. For example, the step-down in oil consumption per capita that occurred in 2020 seems to be still having some effect. Some people are still working from home, saving oil that would be used for commuting. Some long-distance airline flights were eliminated, as well, particularly in Asia, reducing jet fuel consumption.

The self-organizing economy tends to push the world in the direction of contraction. How this will work is not at all clear. Most people didn’t understand the response to Covid-19 as a way to cut back oil consumption. It is possible that future changes will, to some extent, come from cutbacks directed by government organizations that are as difficult to understand as the Covid-19 restrictions.

[5] The book The Limits to Growth, published in 1972, modeled when world resources would run short, relative to growing world population. A recent analysis provides updated estimates, using the same model.

The original 1972 analysis, in its base model, suggested that resources would start to run short about now. An article called, “Recalibration of limits to growth: An update of the World3 model” by Arjuna Nebel and others was published earlier this year in the Journal of Industrial Ecology. The summary exhibit of their findings is shown here as Figure 8.

Figure 8. Output of recalibrated Limits to Growth model, with Gail Tverberg’s labels showing which lines are “Industrial Output” and “Population.” Source.

On Figure 8, Recalibration23 is the name given to the new model output. The BAU dotted line shows the indications from the base (business as usual) 1972 model. I found the coloring a little confusing, so I added the labels “Industrial Output” and “Population” to better mark what I consider the two most important model outputs. Food Production per capita is the green line, which is also important. The calculations are all made in terms of the weight of physical quantities of materials used, for the world as a whole. The financial system is not modeled.

We do not know how accurate a forecast such as this is. I know that Dennis Meadows, who was the leader of the 1972 Limits to Growth analysis, has said that once peak was reached, we could not expect the model to necessarily hold.

Even with this caveat, I find this forecast disturbing. Industrial output per capita (which would include things like automobiles, farm machinery, and computers) is shown as already steeply declining by 2025 in the updated model. This trend is much clearer than in the 1972 model. By 2050, industrial output per capita is a small fraction of the amount it was at peak.

Food output per capita is shown to start dropping about 2025. Based on my understanding of the 1972 Limits to Growth analysis, this change might reflect a shift away from meat-eating, rather than simply fewer total calories per person.

World population follows a curve similar to that of the 1972 Limits to Growth analysis with a peak in world population at perhaps about 2030.

In the updated model, pollution has been modeled as CO2 levels. This is different from the mix of pollutants used in the original model. The peak comes around 2090.

[6] Intuitively, the order of forecast changes for the world economy, shown in Figure 8, seems right to me.

Figure 8 indicates that world industrial production is expected to be the first type of output to drop. This makes sense if energy supply is quite limited or is high-priced. Without adequate inexpensive energy supply, a country is likely to cut back on manufacturing its own goods. Instead, it tries to buy from countries with less expensive sources of energy supply.

For example, US industrial production per capita has been falling since 1973. The year 1973 was the year when oil prices first spiked. US business leaders realized that changes were needed: A larger share of manufactured goods needed to be imported from countries with lower-cost fuel supply. Oil needed to be used sparingly because of its high cost. Coal, used heavily in Asia, was typically much cheaper.

Figure 9. US industrial energy consumption per capita, based on data of the EIA.

China took the lead in industrial production after it joined the World Trade Organization in 2001, but now it is running into obstacles. One issue is that China’s contribution to the world’s supply of goods is taking away high-paying jobs from other countries. Other countries are left with more low-paying service jobs. A second issue is that the US has become dependent upon China for critical materials, such as those used in military armaments. A third issue is that a great deal of China’s growth was financed by debt. As long as China’s exports were growing very rapidly, this was not a problem. But as growth has slowed, China’s debt has become difficult to repay with interest.

The level of conflict between China and other countries has grown, in part because it has become clear that it is not possible for industry to grow rapidly both in China and elsewhere, indirectly because of fossil fuel and uranium limits. The US applies sanctions against some Chinese companies and China retaliates by hoarding scarce resources. These include minerals such as antimony, tungsten, gallium, germanium, graphite, and magnesium.

The world is increasingly operating in a “not enough to go around” mode for scarce resources. At the same time, countries need to somewhat get along. So we get strange narratives in the press giving rationalizations for actions by both sides, without mentioning the shortage issue.

Figure 8 shows that once industrialization drops, food production also begins to fall, but not as quickly. This makes sense because everyone recognizes that food is essential. The falling calories likely reflect people increasingly moving from meat to vegetable products.

Somehow, world population becomes poorer, but the level of population does not drop nearly as rapidly as the drop in industrialization.

[7] Simplification is likely to take place in significant steps, perhaps at the time of strange events, such as those occurring in 2020.

These are a few ways simplification might take place:

[a] High level government organizations might start disappearing. For example, the European Union might not get enough funding and would stop. Or something similar could happen to the International Monetary Fund or the World Trade Organization.

[b] Programs that we expect to be funded by the US Federal Government might be handed over completely to the states, to be funded or not, as the finances of individual states permit. Examples might include Medicare, Medicaid, and even Social Security.

[c] There could be major banking problems, perhaps simultaneously in many countries around the world. The debt bubble holding up stock markets could pop. Governments would try to compensate, but they might not be able to do enough. Or governments could inadvertently create hyperinflation if there is virtually nothing to buy with the newly printed money created to offset widespread bank failures.

[d] There could be a great deal more sharing of homes and of apartments. The current arrangement of many single people living alone, either in an apartment or a stand-alone house could be replaced by many more roommate situations. Multi-generational families living together may become more common.

[e] Healthcare may become much simpler and local. Instead of seeing an array of specialists at a distance, people may walk to a local health provider. Medications from around the world are likely to drop greatly in quantity. Government programs to care for the seriously disabled elderly seem likely to be scaled back.

[f] Universities may be slimmed down greatly. There is no point in educating a huge number of individuals who cannot get jobs requiring a university degree.

[g] The huge amount of effort that goes into taking care of lawns in the US may disappear. Instead, people will put more effort into growing crops locally. Some people may choose to raise chickens, as well.

[h] International travel for pleasure will likely disappear, except perhaps for the very rich. Even business trips will become very uncommon. The amount of goods and services transported internationally seems likely to shrink.

[i] Many types of optional activities that now take place by car may be replaced by more local versions, which will be reached by walking, or perhaps by bicycle. For example, visits to restaurants may largely disappear, but eating with nearby friends or relatives in homes may increase. Visits to churches may drop greatly, as they did during Covid-19 restrictions, but they may be replaced by groups meeting in homes. Gyms for recreation may disappear, but people may obtain more exercise from their gardens and their need to walk to appointments.

[j] Very strange political leaders may take office. One person rule takes much less energy than transporting many representatives to a central location. Some of these leaders may take over as dictators.

Posted in Financial Implications, Food issues, News Related Post | Tagged , , , | 1,651 Comments

Nuclear electricity generation has hidden problems; don’t expect advanced modular units to solve them.

It is easy to get the impression that proposed new modular nuclear generating units will solve the problems of nuclear generation. Perhaps they will allow more nuclear electricity to be generated at a low cost and with much less of a problem with spent fuel.

As I analyze the situation, however, the problems associated with nuclear electricity generation are more complex and immediate than most people perceive. My analysis shows that the world is already dealing with “not enough uranium from mines to go around.” In particular, US production of uranium “peaked”about 1980 (Figure 1).


Figure 1. Chart prepared by the US Energy Information Administration showing US production of uranium oxide.

For many years, the US was able to down-blend nuclear warheads (both purchased from Russia and from its own supply) to get around its uranium supply deficit.

Figure 2. Chart from ArmsControl.org showing estimated global nuclear warhead inventories, 1945 to 2023.

Today, the inventory of nuclear warheads has dropped quite low. There are few warheads available for down-blending. This is creating a limit on uranium supply that is only now starting to hit.

Nuclear warheads, besides providing uranium in general, are important for the fact that they provide a concentrated source of uranium-235, which is the isotope of uranium that can sustain a nuclear reaction. With the warhead supply depleting, the US has a second huge problem: developing a way to produce nuclear fuel, probably mostly from spent fuel, with the desired high concentration of uranium-235. Today, Russia is the primary supplier of enriched uranium.

The plan of the US is to use government research grants to kickstart work on new small modular nuclear reactors that will be more efficient than current nuclear plants. These reactors will use a new fuel with a higher concentration of uranium-235 than is available today, except through purchase from Russia. Grants are also being given to start work on US production of the more highly enriched uranium fuel within the US. It is hoped that most of this highly enriched uranium can come from recycling spent nuclear fuel, thus helping to solve the problem of what to do with the supply of spent fuel.

My analysis indicates that while advanced modular nuclear reactors might theoretically be helpful for the very long term, they cannot fix the problems of the US, and other countries in the West, nearly quickly enough. I expect that the Trump administration, which will start in January 2025, will see this program as a boondoggle.

[1] Current problems with nuclear electricity generation are surprisingly hidden. World electricity generation from nuclear has been close to flat since 2004.

Figure 3. World Nuclear Electricity Generation based on data of the 2024 Statistical Review of World Energy, published by the Energy Institute.

Although there was a dip in world generation of nuclear electricity after the tsunami that affected nuclear reactors in Fukushima, Japan, in 2011, otherwise world production of nuclear electricity has been nearly flat since 2004 (Figure 3).

Figure 4. US Nuclear Electricity Generation based on data of the 2024 Statistical Review of World Energy, published by the Energy Institute.

US nuclear electricity production (Figure 4) shows a similar pattern, except that production since 2021 is down.

[2] The total amount of electricity generated by nuclear power plants is limited by the amount of uranium fuel available to them.

I believe that a major reason why the electricity supply from nuclear has been quite flat since 2004 is because total nuclear electricity generation is limited by the quantity of uranium fuel that is available for the nuclear reactors that have been built.

The price of uranium can perhaps rise, but this doesn’t necessarily add much (or any) supply very quickly. It takes several years to develop a new uranium mine.

In theory, reprocessing of spent fuel to produce uranium and plutonium is also possible, but the amount of that has been performed to date is small. (See Section [6].)

[3] The World Nuclear Association (WNA) published Figure 5 that hints at the world’s uranium supply problem:

Figure 5. World uranium production and reactor requirements (metric tons of uranium) in a chart by the World Nuclear Association.

The black line showing “reactor requirements” (Figure 5) is in some sense comparable to world generation of nuclear electricity (Figure 3). Both figures show fairly flat lines since about 2004. This relationship hints that there has not been a significant improvement in the efficiency of electricity generation using uranium fuel in the past 20 years.

Figure 5 shows a huge gap between the production of uranium from the various countries and “reactor requirements.” The single largest source of additional supply has been down-blended uranium from nuclear bombs. The EIA reports that the US purchased a large number of nuclear warheads from Russia between 1995 and 2013 for this purpose under the Megatons to Megawatts program. The EIA also reports that for the period 2013 to 2022, a purchase agreement was put in place allowing the US to purchase commercial origin low-enriched uranium from Russia to replace some of down-blended nuclear warhead material. In addition, the US had some of its own nuclear warheads that it could blend down. It was the availability of uranium supply from these various sources that allowed US nuclear electricity generation to remain relatively flat in the 2004 to 2023 period, as shown on Figure 4.

The US’s own uranium extraction reached a peak about 1980 and is now close to zero (Figure 1). The world’s supply of warheads is now over 85% depleted, leaving very little stored-away, highly enriched uranium to blend down (Figure 2)

A hidden problem is the fact that uranium production available today is largely from Russia and its close affiliates. The data underlying Figure 5 shows that uranium production in 2022 is dominated by close allies of Russia (55% of the total coming from Kazakhstan (43% of total), Uzbekistan (7% of total), and Russia (5% of total)). The US (at almost 0%), plus production of its close affiliates, Canada and Australia, provided only 24% of world uranium. This imbalance between Russia and its affiliates, and the US and its affiliates, should be of concern.

[4] The current conflict between the US and Russia adds to nuclear problems.

The US is trying to impose sanctions on Russia. The EIA reports:

“The origin of uranium used in U.S. reactors will likely change in the coming years. In May [2024], the United States banned imports of uranium products from Russia beginning in August [2024], although companies may apply for waivers through January 1, 2028.”

This seems to imply that a transition away from Russian uranium dependence must be made in only a little over three years. This is a short time frame, given the difficulty in making such a transition.

EIA data show that in the year 2023, the US sourced only 4.6% of uranium supplies from the US. (This could be partly or mostly down-blended nuclear warheads). Material purchased from Russia comprised 11.7% of uranium. Kazakhstan provided 20.6% of uranium purchased, and Uzbekistan provided 9.5%. Among US allies, Canada provided 14.9%, and Australia 9.2%.

[5] The WNA does not hint at any uranium supply problems.

The WNA is an advocate for nuclear energy; it cannot suggest that there is any problem with uranium supplies. WNA has the opinion that if there is a shortage of uranium, prices will rise, and more will become available. But even if prices rise, it takes several years to bring new mines into operation. Prices need to stay high, or companies will not pursue what appear to be opportunities.

Figure 6. Historical uranium prices in chart by Trading Economics.

Readers of OurFiniteWorld.com have seen that oil prices tend to spike and collapse. They don’t stay high for very long because if prices stay high, the end products made with oil tend to become unaffordable. I expect a similar problem occurs with uranium.

The necessary price threshold for high uranium extraction that is mentioned by the WNA is $130/kg in 2021. By coincidence, when a translation is made to dollars per pound using 2024$, this corresponds quite closely to the current price line on Figure 6. Indeed, prices do sometimes bounce high. The problem is getting them to stay as high as the dotted line for long enough to support the multi-decade life of a mine. Economists were forecasting a price of $300 per barrel oil a few years ago, but they have been disappointed. The price is under $75 per barrel now.

The country with the most potentially recoverable uranium is Australia. It produced only 9% of the world’s uranium in 2022, but is reported to have 28% of the world’s remaining reserve. Consistently higher prices would be needed for Australia to start opening new mines.

It is also possible that more uranium supply might become available if improved extraction techniques are developed.

The world seems to be past peak crude oil. By itself, the peak oil issue could limit new uranium extraction and transport.

[6] Recycling of spent fuel to recover usable uranium and plutonium has been accomplished only to a limited extent. Experience to date suggests that recycling has many issues.

It is possible to make an estimate of the amount of recycling of spent fuel that is currently being performed. Figure 3 in Section [1] shows about 65,000 metric tons of uranium are required to meet the demands of existing nuclear power generation, and that as of 2022, there was about an annual shortfall in supply of about 26%. Based on what information I have been able to gather, existing recycling of uranium and plutonium amounts to perhaps 6% of the overall fuel requirement. Thus, as of 2022, today’s recycling of spent fuel could perhaps shave this shortfall in uranium supply to “only” 20% of annual nuclear fuel requirements. There is some recycling of spent fuel, but it is small in relation to the amount needed.

There seem to be several issues with building units to recover uranium from spent fuel:

  1. Higher cost than simply mining more uranium
  2. Pollution problems from the recycling plants
  3. Potential for use of the output to make nuclear warheads
  4. Potential for nuclear accidents within the plants
  5. Remaining radioactivity at the site at the end of the reprocessing plant’s life, and thus the need to decommission such plants
  6. Potential for many protestors disrupting construction and operation because of issues (2), (3), (4), and (5)

The US outlawed recycling of spent fuel in 1977, after a few not-very-successful attempts. Once the purchase of Russian warheads was arranged, down-blending of warheads was a much less expensive approach than reprocessing spent fuel. Physics Today recently reported the following regarding US reprocessing:

“A plant in West Valley, New York, reprocessed spent fuel for six years before closing in 1972. Looking to expand the plant, the owners balked at the costs required for upgrades needed to meet new regulatory standards. Construction of a reprocessing plant in Barnwell, South Carolina, was halted in 1977 following the Carter administration’s ban.”

Japan has been trying to build a commercial spent fuel reprocessing plant at Rokkasho since 1993, but it has had huge problems with cost overruns and protests by many groups. The latest estimate of when the plant will actually be completed is fiscal year 2026 or 2027. The plant would process 800 metric tons of fuel per year.

The largest commercial spent fuel reprocessing plant in operation is in La Hague, France. It has been in place long enough (since 1966) that it has run into the issue of decommissioning an old unit, which was started as a French military project. The first processing unit was shut down in 2003. The International Atomic Energy Administration says, “The UP2-400 decommissioning project began some 20 years ago and may be expected to continue for several more years.” It talks about the huge cost and number of people involved. It says, “Decommissioning activities represent roughly 20 per cent of the overall activity and socio-economic impact of the La Hague site, which also hosts two operating spent fuel recycling plants.”

The cost of the La Hague reprocessing units is probably not fully known. They were built by government agencies. They have gone through various owners including AREVA. AREVA has had huge financial problems. The successor company is Orano. The currently operating units have the capacity to process about 1,700 metric tons of fuel per year. The 1700 metric tons of reprocessing of spent fuel from La Hague is reported to be nearly half of the world’s operating capacity for recycling spent fuel.

I understand that Russia is working on approaches that quite possibly are not included in my figures. If so, this may add to world uranium supply, but Russia is not likely to want to share the benefits with the West if there is not enough to go around.

[7] The concentration of the isotope uranium-235 is very important in making fuel for the proposed new modular nuclear reactors.

Uranium-235 makes up 0.72% of natural uranium. Wikipedia says, “Unlike the predominant isotope uranium-238, it [uranium-235] is fissile, i. e., it can sustain a nuclear reaction.” In most reactors used today, the concentration of uranium-235 is 3% to 5%.

According to CNN, the plan in building advanced modular small reactors is to use fuel with a 5% to 20% concentration of uranium-235. Fuel at this concentration is called high assay low-enriched uranium, or HALEU. The expectation is that power plants with this type of fuel will be more efficient to operate.

Producing higher concentrations of uranium-235 tends to be problematic unless nuclear weapons are available for down-blending; warheads use high concentrations of uranium-235. Now, with reduced availability of nuclear warheads for down-blending, other sources are needed in addition. CNN reports that the only commercial source of HALEU is Russia. The EIA reports that the Inflation Reduction Act invested $700 million to support the development of a domestic supply chain for HALEU.

[8] The US is trying to implement many new ideas at one time with virtually no successful working models to smooth the transition.

Strangely enough, the US has no working model of a small-scale nuclear reactor, even one operating on conventional fuel. A CNBC article from September 2024 says, Small nuclear reactors could power the world, the challenge is building the first one in the US.

The new small-scale nuclear projects we do have are still at a very preliminary stage. In June 2024, Bill Gates wrote, “We just broke ground on America’s first next-gen nuclear facility. Kemmerer, Wyoming will soon be home to the most advanced nuclear facility in the world.” The plan is for it is to become operational by 2030, if it has access to HALEU fuel.

With respect to how far along the ability to make HALEU from spent fuel is, an October 2024 article in Interesting Engineering says, “US approves new facility design concept to turn nuclear waste into reactor fuel:”

“The facility whose conceptual design has been approved will be located at Idaho National Laboratory (INL). It will help turn used material recovered from DOE’s former Experimental Breeder Reactor-II (EBR-II reactor) into usable fuel for its advanced nuclear power plant. . . The plan is to recover approximately 10 metric tons of HALEU from EBR-II fuel by December 2028 using an electrochemical process that was perfected over the years at Idaho National Laboratory (INL).”

Assuming this can be done, it will be a step forward, but it is nowhere near being an at-scale, commercial project that can be done economically by other companies. The volume of 10 metric tons is tiny.

Starting at this level, it is difficult to see how reactors with the new technology and the HALEU fuel to feed them can possibly be available in quantity before 2050.

[9] It is difficult to see how the cost of electricity generated using the new advanced modular nuclear reactors and the new HALEU fuel, created by reprocessing spent fuel, could be low.

As far as I can see, the main argument that these new modular electricity generation plants will be affordable is that they will only generate a relatively small amount of electricity at once about 300 megawatts or less, or about one third of the average of conventional nuclear reactors in the US. Because of the smaller electricity output, the hope is that they will be affordable by more buyers, such as utility companies.

The issue that is often overlooked by economists is that electricity generated using these new techniques needs to be low cost, per kilowatt-hour, to be helpful. High-cost electricity is not affordable. Keeping costs down when many new approaches are being tried for the first time is likely to be a huge hurdle. I look through the long list of problems encountered in recycling spent fuel mentioned in Section [6] and wonder whether these issues can be inexpensively worked around. There are also issues with adopting and installing the proposed new advanced modular reactors, such as security, that I have not even tried to address.

The hope is that somehow, the whole process of building the advanced modular nuclear reactors and creating the HALEU fuel can be standardized and can be organized in such a way that economies of scale will set in. It seems to me that reaching this goal will be difficult. In theory, perhaps such a goal can be reached in 2060 or 2070, but this is not nearly soon enough, given the world’s current shortage of uranium from mines.

[10] The Trump administration will likely drop or substantially change the current program for advanced modular nuclear reactors.

The US plan that is discussed in this post has been developed under the Biden administration. This group was voted out of power on November 5. The Democratic administration will be replaced by a new Republican administration, headed by Donald Trump, on January 20, 2025.

I would not be surprised if the advanced modular nuclear generation plan disappears, almost as quickly as the currently subsidized offshore wind program, which Trump has vowed to end. The two programs have many things in common: Both programs provide an excuse for more US debt; they provide many jobs for researchers; and the devices that they relate to can be purchased in fairly small increments. But the cost per kilowatt-hour of electricity is likely to be high with either program. In some sense, as they are currently envisioned, they will not efficient ways to produce electricity. A major problem is the lack of fuel for the new modular reactors, and the slow ramp-up time to obtain this fuel.

I expect that under Trump, the sanction against purchasing HALEU from Russia might be replaced with a tariff. That way the US could have the benefit of HALEU, purchased from Russia, but at a higher price. This would allow research to continue, if desired.

[11] If solutions cannot be found, electricity generation from nuclear is likely to gradually disappear.

Over time, the world’s self-organizing economy tends to eliminate its more inefficient parts. When I look at the past experience with nuclear, what I see seems to be another example of the self-organizing economy squeezing out the inefficient parts of the economy (Figure 7):

Figure 7. Nuclear electricity generation by part of the world, based on data of the 2024 Statistical Review of World Energy, published by the Energy Institute.

In this chart, “Advanced Economies, ex US” are defined as members of the Organization for Economic Development (OECD), excluding the US. “Later Entrants” are non-OECD members, excluding Russia and Ukraine. They include China, India, Indonesia, and many other lower-income countries. Many of these countries are in East Asia.

What I see is that the relatively “flat” overall nuclear electricity production has been accomplished, to a significant extent, by the “Advanced Economies, ex US” dropping back in their use of nuclear electricity at close to the same time the “Later Entrants” have rapidly been increasing their use of nuclear electricity. The Later Entrants can make goods for sale in international markets much more cheaply than the Advanced Economies, ex US through their efficient use of cheap energy (often from coal) and their lower wages. This more efficient approach gives the Later Entrants an “edge” in buying the uranium that is available.

I expect to see more of this pattern of squeezing out in the future. In fact, new and recently re-opened nuclear plants will need to compete existing nuclear generation units for available uranium.

Given the way squeezing out takes place, very few people will realize that there is a problem with uranium fuel. It will just be that leaders of some parts of the world, as well as some parts of the US, will start emphasizing stories about how dangerous nuclear energy is. Instead of nuclear, they will emphasize electricity generation from wind and solar and allow these approaches to “go first” when they are available. The result will be wholesale electricity prices that will be far too low for nuclear power plants, much of the time. It will be these low wholesale electricity prices that push nuclear power out.

Thus, unless there truly are breakthroughs in recycling spent fuels, or in uranium mining, electricity generation using nuclear energy may gradually slip away from many parts of the world currently using it.

Posted in Alternatives to Oil | Tagged | 1,824 Comments